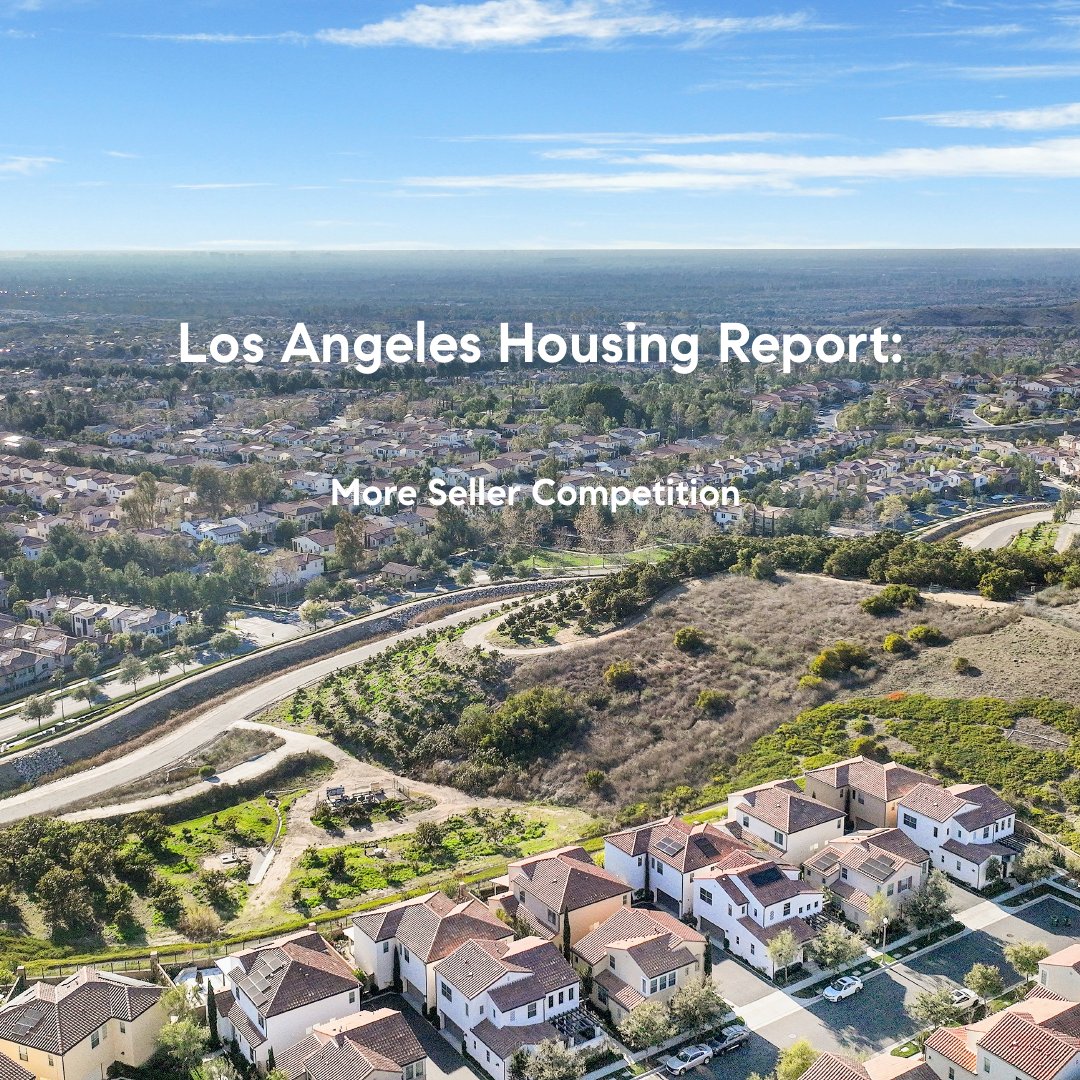
Los Angeles County Housing Market: More Seller Competition
The Los Angeles County housing market is seeing a surge in seller competition as more homeowners list their properties, pushing inventory to its highest mid-February level since 2019. Active listings have jumped 42% year-over-year to 10,662 homes, driven by sellers who had delayed moving due to low mortgage rates but are now re-entering the market. However, buyer demand remains low, causing the Expected Market Time to climb to 92 days, the slowest mid-February pace on record.
As the spring market approaches, even more homes will hit the market, increasing seller competition. Overpricing is a risky strategy, as homes that aren’t priced correctly may sit unsold. The luxury market has seen an uptick in demand, particularly in the $2M+ range, partly due to the Pacific Palisades and Alta Dena fires, which displaced thousands. Meanwhile, rental demand has surged 53%, as fire victims seek long-term housing.
With more homes and steady mortgage rates, sellers must price strategically to stand out. Buyers, on the other hand, have more options but must navigate affordability challenges. As the market heads into its busiest season, understanding pricing trends will be key to making smart real estate decisions.

Los Angeles County Housing Summary
- The active listing inventory in the past couple of weeks increased by 355 homes, up 3%, and now sits at 10,662 homes, its highest level for this time of year since 2019. In January, 3% fewer homes came on the market compared to the 3-year average before COVID (2017 to 2019), 187 less. Yet, 1,488 more sellers came on the market this January compared to January 2024. Last year, there were 7,505 homes on the market, 3,157 fewer homes, or 30% less. The 3-year average before COVID (2017 to 2019) was 10,806, or 1% more.
- Demand, the number of pending sales over the prior month, surged higher by 606 pending sales in the past two weeks, up 21%, and now totals 3,479, its largest rise since the start of last February. Yet, it is the lowest level for this time of year since tracking began in 2012. Last year, there were 3,491 pending sales, up 12 or 8% more. The 3-year average before COVID (2017 to 2019) was 5,089, or 46% more.
- With demand surging higher compared to the smaller rise in supply, the Expected Market Time (the number of days it takes to sell all Los Angeles County listings at the current buying pace) plunged from 108 to 92 days in the past couple of weeks. Yet, it is the highest level for this time of year since tracking began in 2012. It was 64 days last year, substantially faster than today. The 3-year average before COVID (2017 to 2019) was 65 days, also much faster than today.
- In the past couple of weeks, the Expected Market Time for homes priced below $750,000 decreased from 85 to 76 days. This range represents 29% of the active inventory and 34% of demand.
- The Expected Market Time for homes priced between $750,000 and $1 million decreased from 81 to 72 days. This range represents 19% of the active inventory and 24% of demand.
- The Expected Market Time for homes priced between $1 million and $1.5 million decreased from 103 to 81 days. This range represents 16% of the active inventory and 19% of demand.
- The Expected Market Time for homes priced between $1.5 million and $2 million decreased from 137 to 101 days. This range represents 10% of the active inventory and 9% of demand.
- In the past two weeks, the Expected Market Time for homes priced between $2 million and $3 million decreased from 144 to 121 days. The Expected Market Time for homes priced between $3 million and $4 million decreased from 168 to 145 days. The Expected Market Time for homes priced between $4 million and $8 million decreased from 294 to 235 days. The Expected Market Time for homes priced above $8 million decreased from 815 to 549 days.
- The luxury end, all homes above $2 million, account for 26% of the inventory and 14% of demand.
- Distressed homes, both short sales and foreclosures combined, made up only 0.8% of all listings and 1.1% of demand. Only 55 foreclosures and 32 short sales are available to purchase today in all of Los Angeles County, with 87 total distressed homes on the active market, down three from two weeks ago. Last year, there were 59 total distressed homes on the market, slightly fewer than today.
- There were 2,800 closed residential resales in January, down 1% compared to January 2024’s 2,823 closed sales and down 26% from December 2024. The sales-to-list price ratio was 97.6% for all of Los Angeles County. Foreclosures accounted for just 0.6% of all closed sales, and short sales accounted for 0.1%. That means that 99.3% of all sales were good ol’ fashioned sellers with equity.
For more information and to learn about the current housing market in LA, please contact me.