Orange County Housing Market Update – Buyer’s Market Arrives
For the first time since 2011, the Orange County housing market has officially shifted into buyer’s market territory. This marks the slowest June the county has seen in over a decade.
Here’s what you need to know:
Inventory Surging, Demand Steady
Inventory is up 61% year-over-year, giving buyers many more options compared to recent years. Meanwhile, buyer demand has remained nearly unchanged, creating the right conditions for a slower-paced, more buyer-friendly market.
Longer Time to Sell
The Expected Market Time—how long it would take to sell all active homes at the current pace—has climbed by 60% compared to last year, and is now more than double what it was two years ago. This is the longest June market time in Orange County since 2011.
Sellers Are Adjusting
-
37% of all active listings have reduced their asking price.
-
The number of homes pulled off the market by sellers has risen 96% compared to last year.
-
Sellers are noticeably more open to negotiation than in years past.
Price Trends: Don’t Wait for a Crash
Despite the market slowing, home values are still up 4.6% year-over-year, though slightly down 0.4% month-over-month.
Prices are expected to drift slightly lower through the rest of the year—but not crash. Why? Most homeowners are in strong financial positions, with fixed-rate mortgages, significant equity, or no mortgage at all. Desperate selling is rare, and overall housing stock remains very stable.
What This Means for You:
Buyers:
Now is a prime time to act. With more choices and less competition, buyers finally have negotiation power. Don’t wait for a major price drop—it’s not coming.
Sellers:
To succeed in this shifting market, accurate pricing is everything. Homes priced right from the start are the ones that sell. Overpricing only leads to wasted time and lost momentum.
Orange County Housing Summary
- INVENTORY: The active listing inventory in the past couple of weeks increased by 249 homes, up 5%, and now sits at 4,894, its highest level since June 2020. Last year, there were 3,048 homes on the market, 1,846 fewer homes, or 38% less. The 3-year average before COVID (2017-2019) was 6,633, which is 36% higher. From January through May, 25% fewer homes came on the market compared to the 3-year average before COVID (2017-2019), 4,585 less. Yet, 1,908 more sellers came on the market this year than last, and 3,632 more compared to 2023.
- DEMAND: Buyer demand, the number of pending sales over the prior month, decreased from 1,633 to 1,614. Last year, there were 1,615 pending sales, nearly the same as today. The 3-year average before COVID (2017-2019) was 2,679, which is 66% higher.
- MARKET TIME: With supply rising and demand falling slightly, the Expected Market Time, the number of days to sell all Orange County listings at the current buying pace, increased from 85 to 91 days in the past couple of weeks. Last year, it was 57 days, substantially faster than today. The 3-year average before COVID (2017-2019) was 75 days, which is also significantly faster than today.
- LUXURY: In the past two weeks, the Expected Market Time for homes priced between $2.5 million and $4 million increased from 151 to 170 days. For homes priced between $4 million and $6 million, the Expected Market Time increased from 248 to 251 days. For homes priced above $6 million, the Expected Market Time increased from 324 to 330 days.
- DISTRESSED HOMES: Short sales and foreclosures combined, comprised only 0.2% of all listings and 0.2% of demand. Only seven foreclosures and five short sales are available today in Orange County, with a total of 12 distressed homes on the active market, up four from two weeks ago. Last year, five distressed homes were on the market, similar to today.
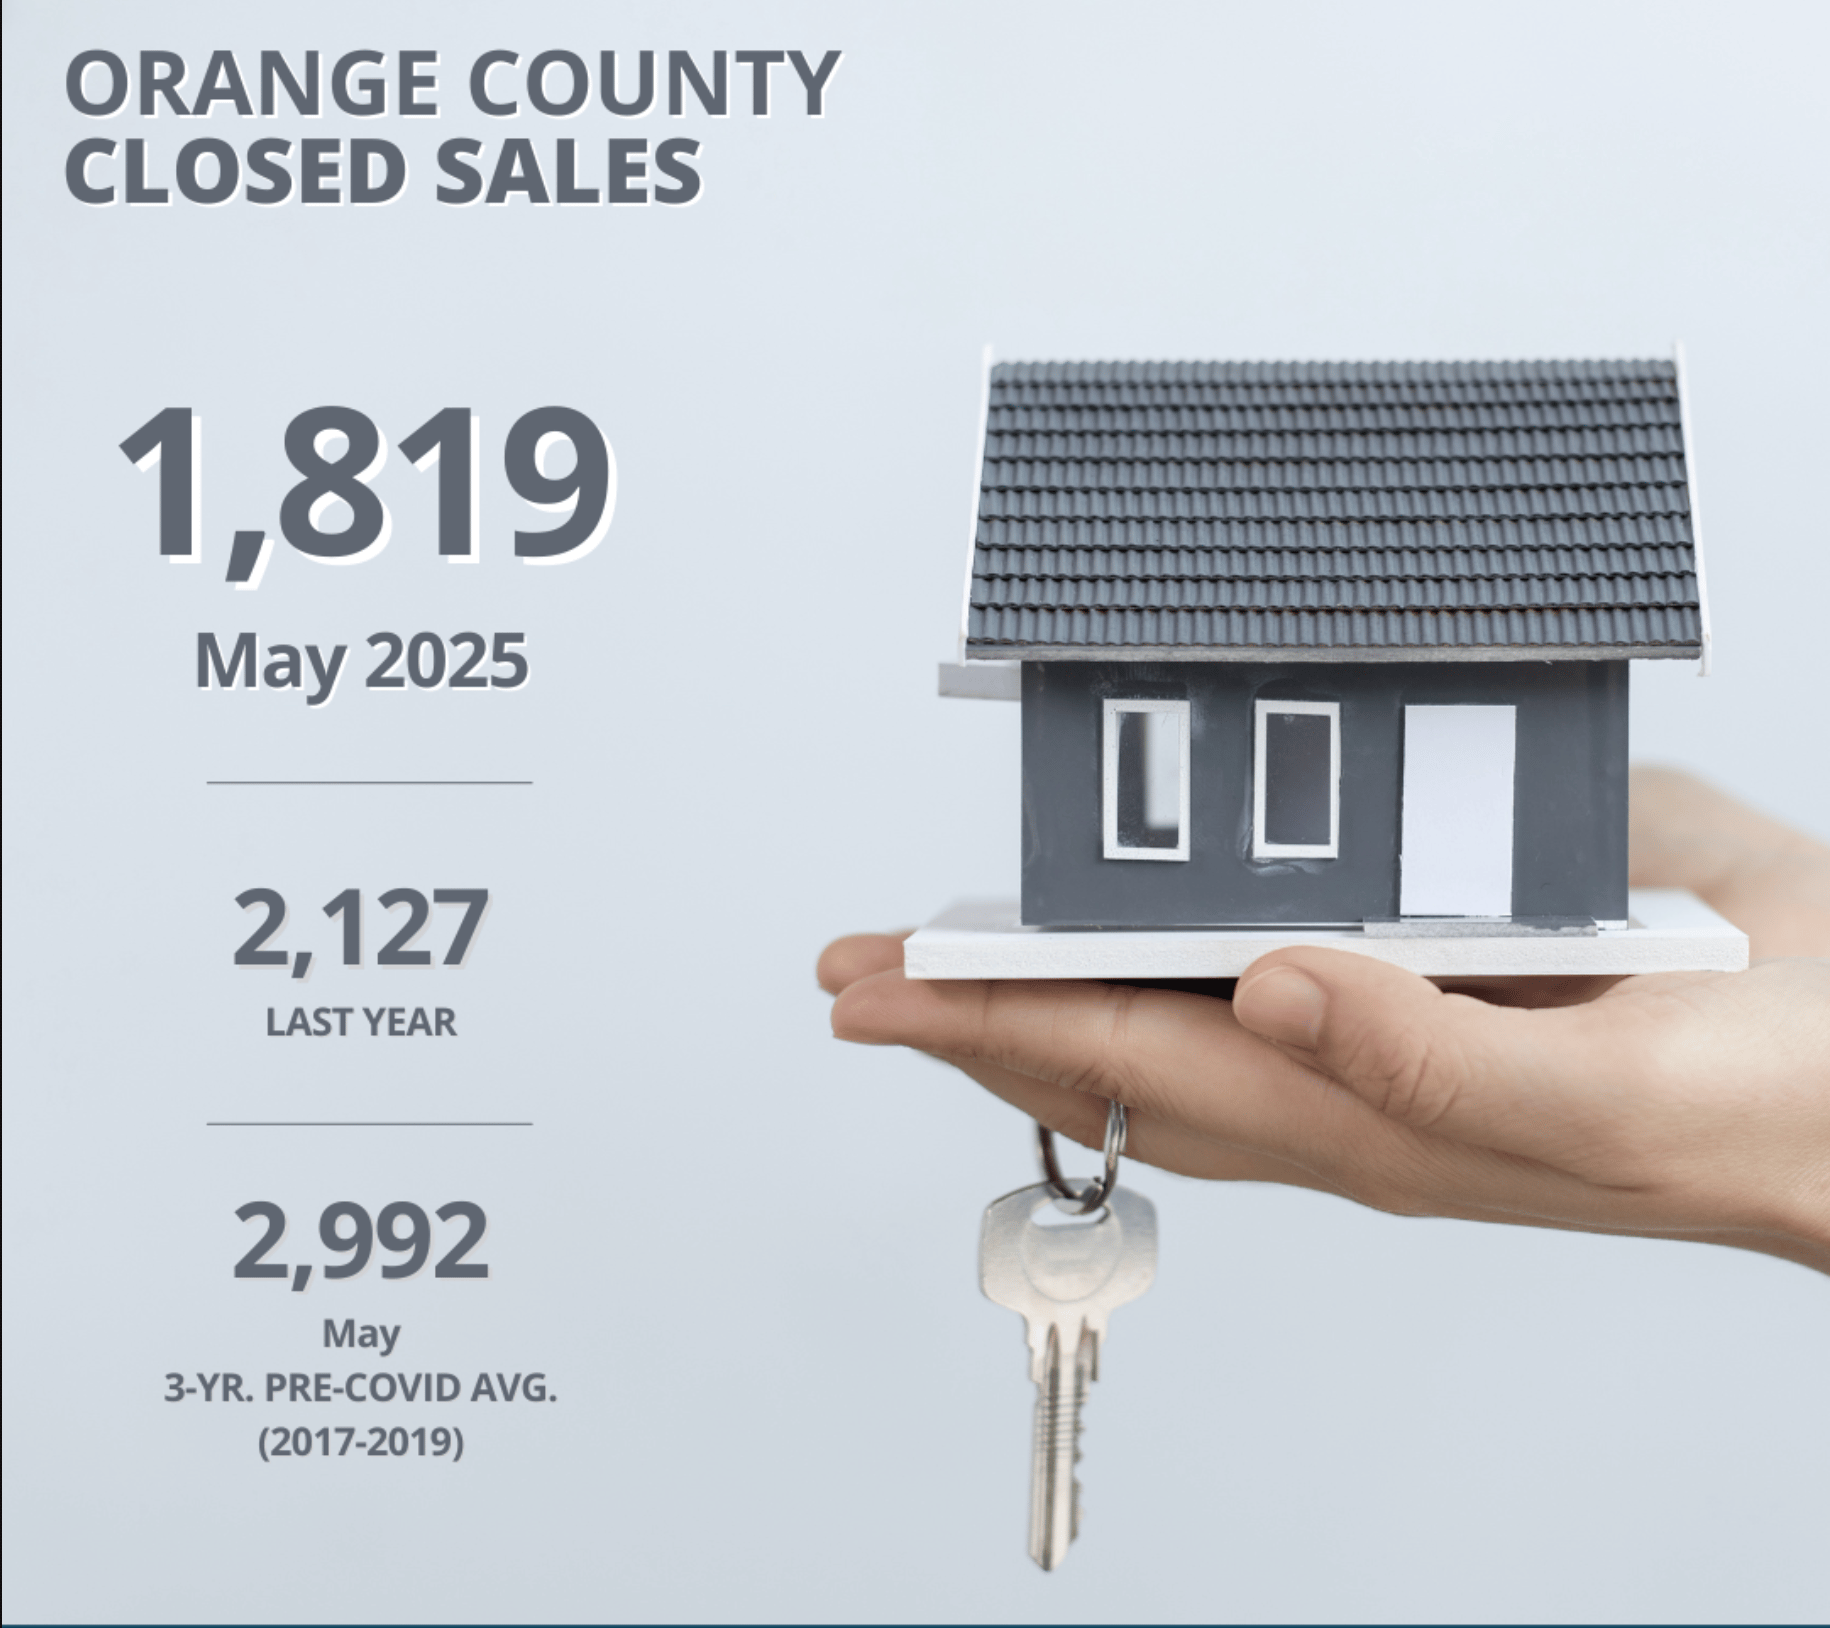
- CLOSED SALES: There were 1,819 closed residential resales in May, down 14% compared to May 2024’s 2,127 and down 2% from April 2025. The sales-to-list price ratio was 98.7% for Orange County. Foreclosures accounted for 0.2% of all closed sales, and short sales accounted for 0.1%. That means that 99.7% of all sales were sellers with equity.
Every neighborhood in Orange County has its own unique rhythm and market conditions. While this report gives you a high-level overview, real estate is hyper-local—what’s happening in Irvine may be very different from Newport Beach.
📞 If you're thinking of buying or selling, or just want to understand what's happening in your specific area, let's connect. I’d be happy to provide a local market snapshot and help you build a strategy tailored to your goals.