Then and Now: 2008 vs. Today
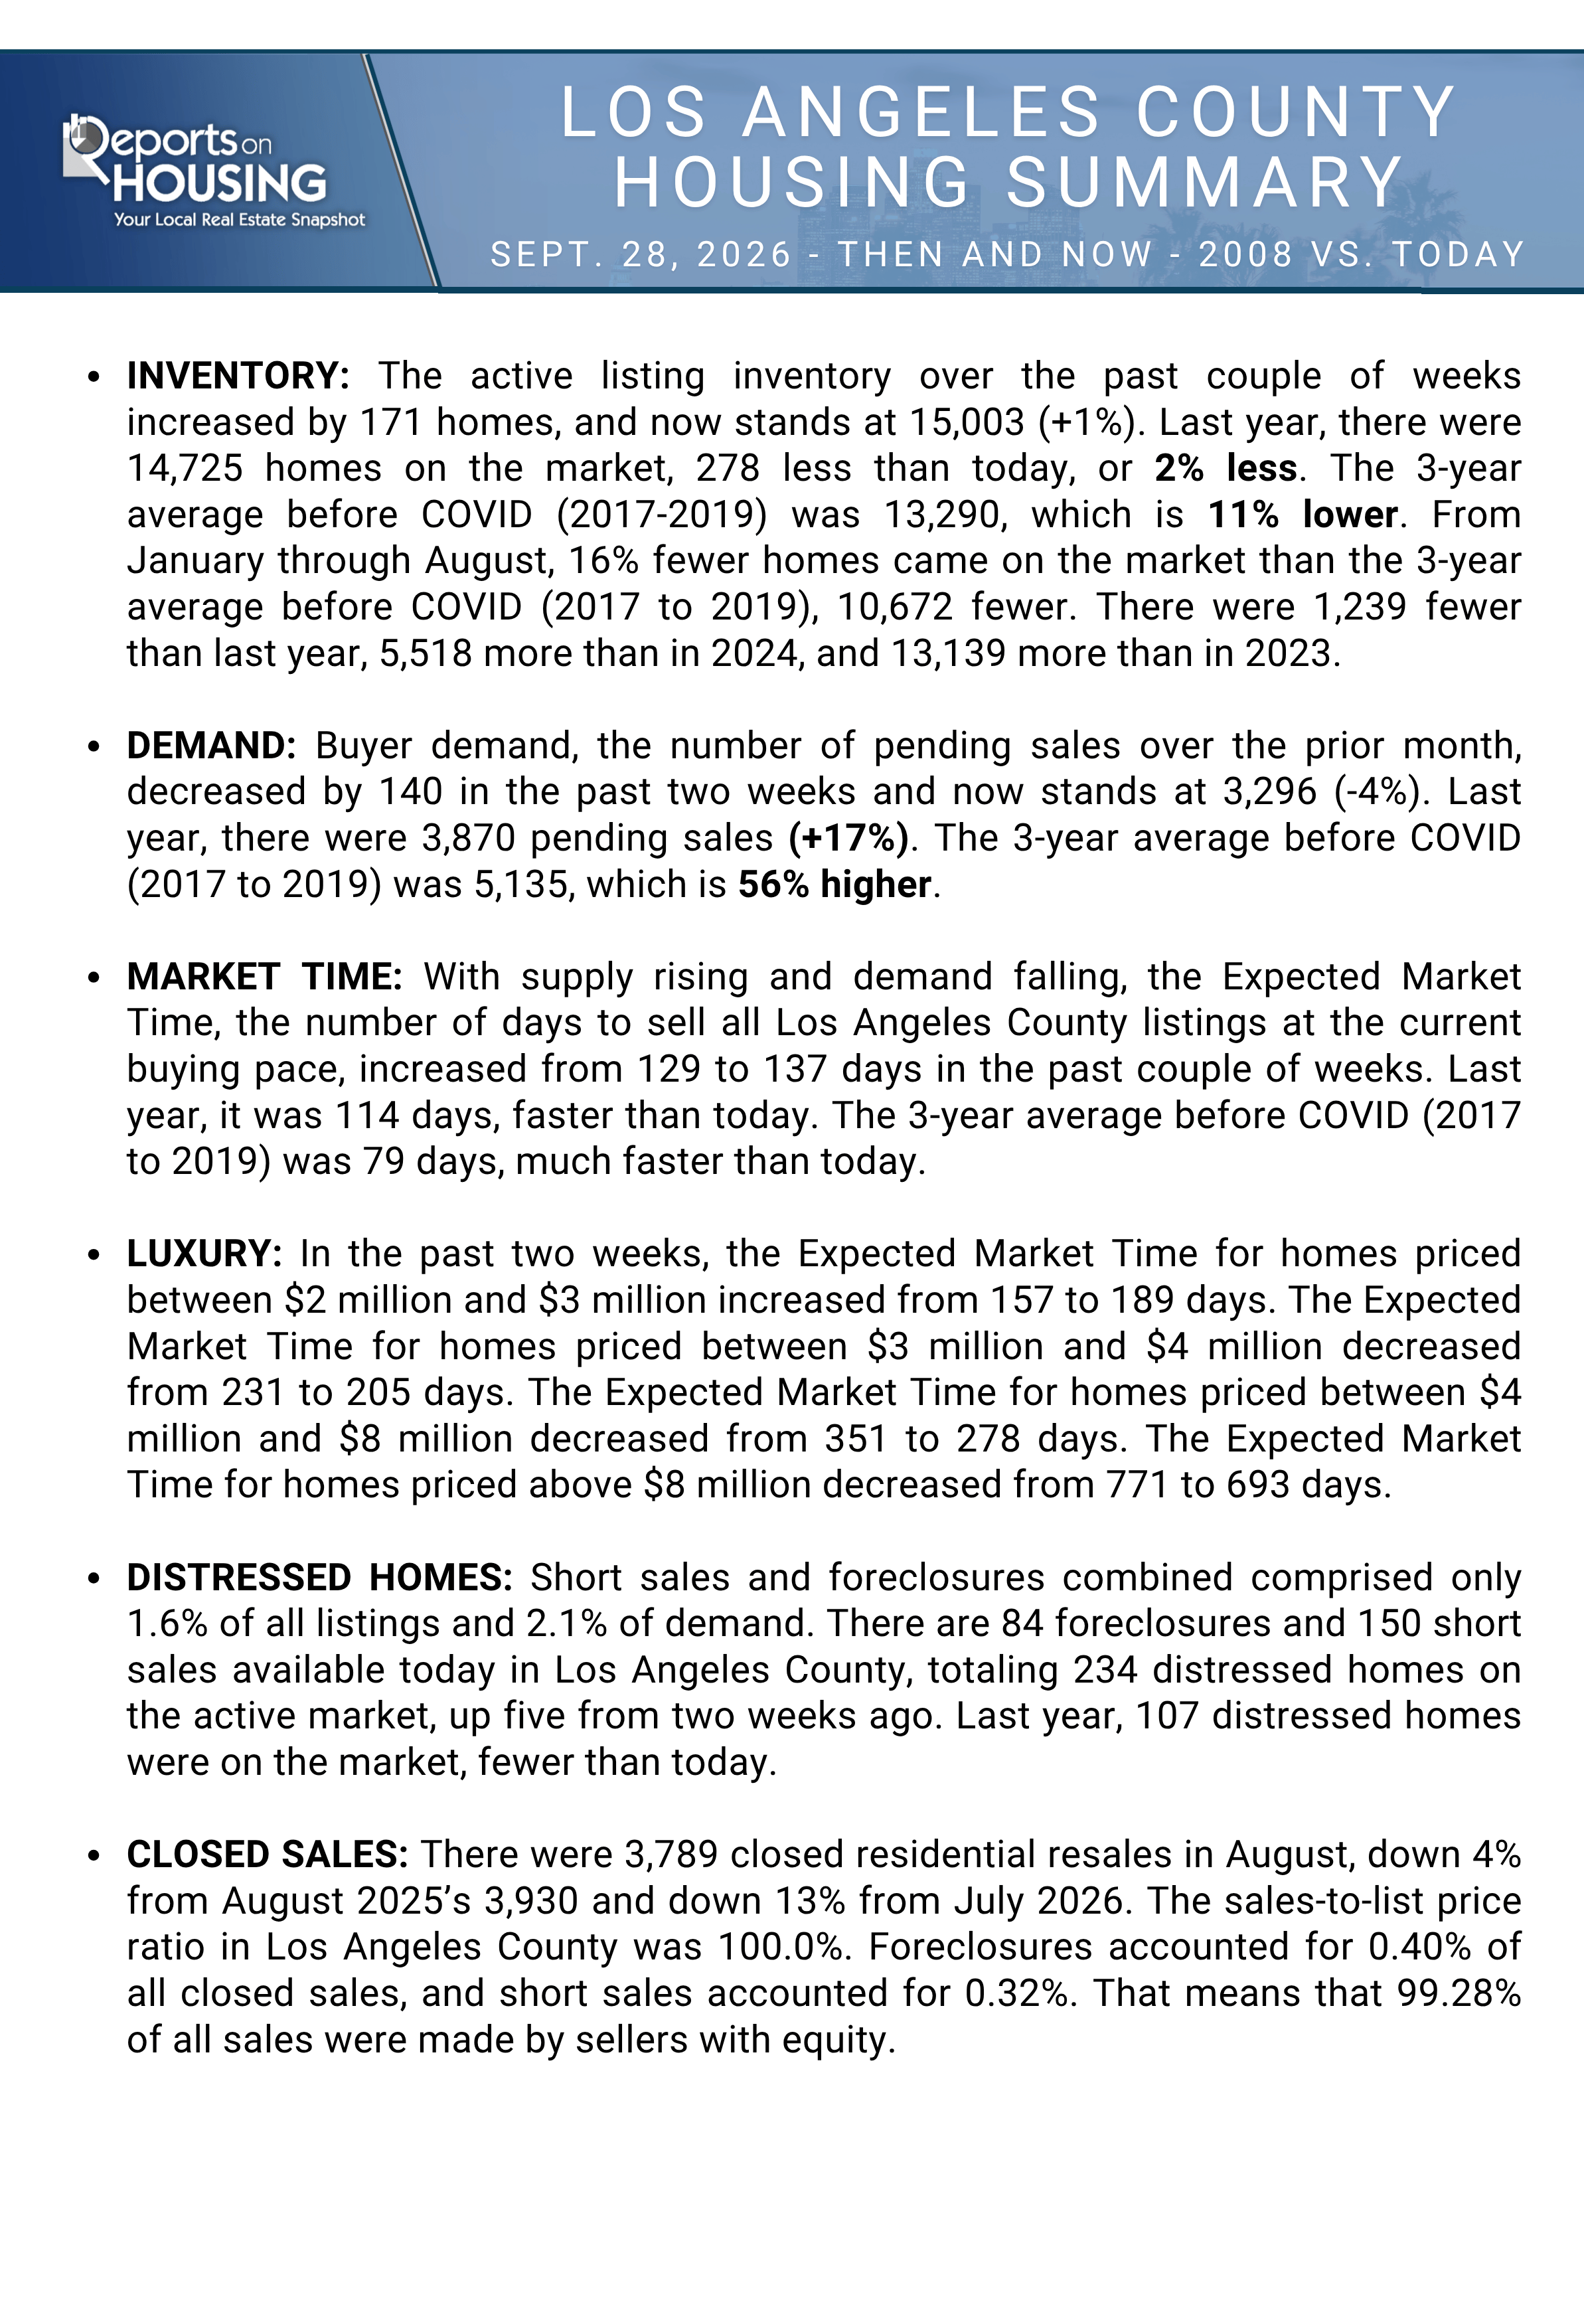
When homes take longer to sell and mortgage rates rise, it’s understandable to wonder whether another housing downturn is ahead. For many homeowners, the memory of 2008 still shapes how they interpret a slower market.
The latest Los Angeles County Housing Report points to important differences between then and now. Buyers are facing affordability challenges, and sellers are facing more competition. But the inventory and distressed-sale figures look very different from those surrounding the Great Recession.
A Slower Market With a Different Foundation
Los Angeles County had nearly 47,000 homes on the market in 2007. Today, the report counts 15,003, roughly one-third as many.
The report also describes stronger lending qualifications and greater homeowner equity than in the years leading up to the financial crisis. Those differences matter because a homeowner with equity and manageable financing has more options than an owner under pressure to sell.
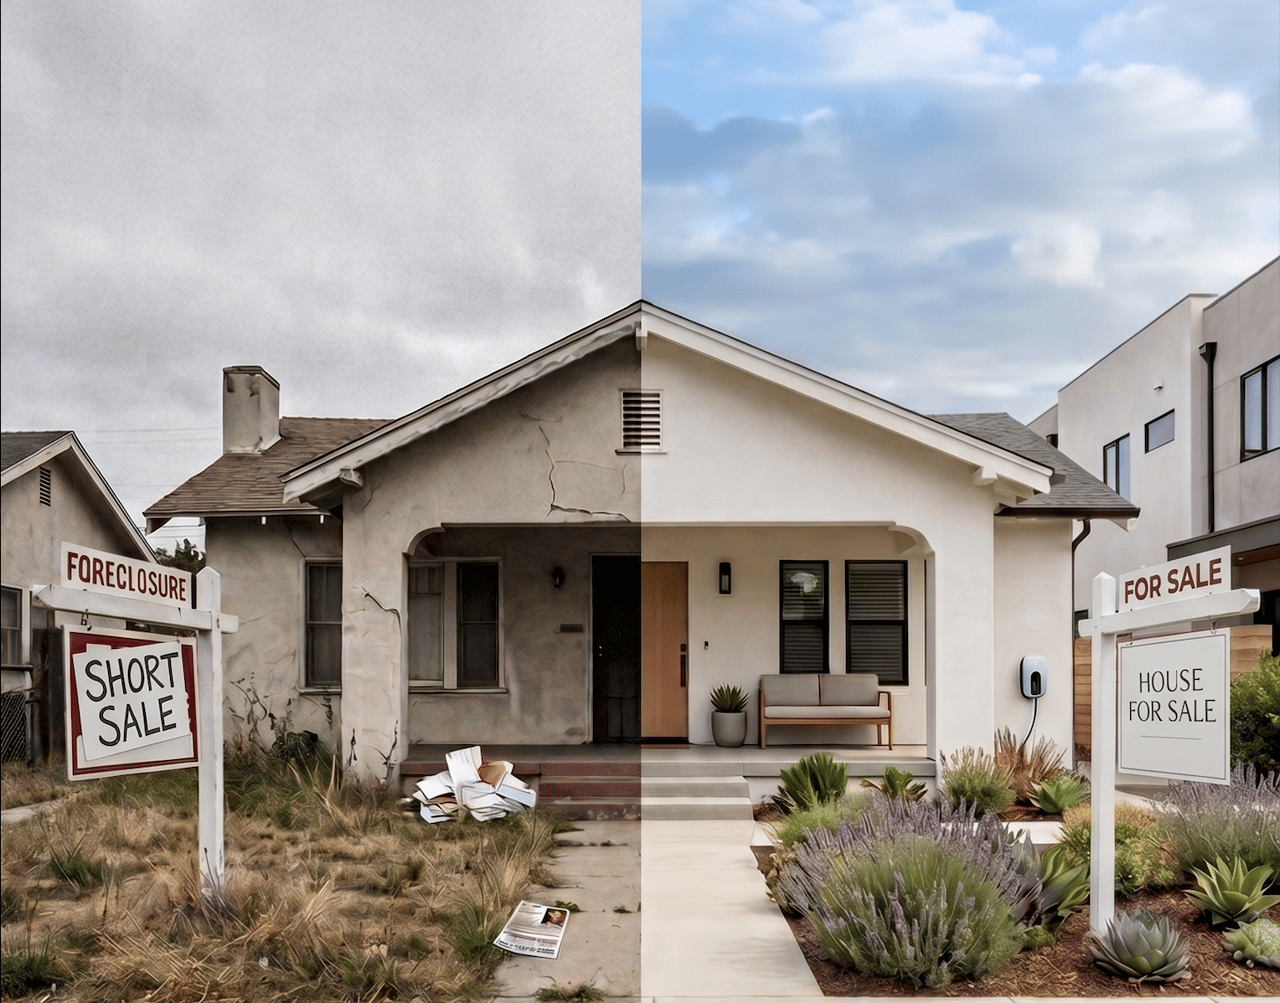
Distressed sales illustrate the contrast. Los Angeles County recorded 18,519 foreclosure and short-sale closings in 2008 and 31,407 in 2009. In 2025, there were 272; through August 2026, there were 247.
These figures do not guarantee that prices will hold steady. They do suggest that today’s slowdown should be evaluated on its own conditions, rather than assuming it will follow the same path as 2008.
Higher Rates Are Weighing on Buyer Activity
According to the September 28 report, mortgage rates reached approximately 7.5%, compared with about 6.75% in August. These are report-date figures, not a current loan quote; individual financing terms vary.
That increase puts more pressure on monthly payments. Buyer demand, measured by new pending sales over the preceding month, fell 4% in two weeks to 3,296. The report identifies this as the weakest September demand reading since its tracking began in 2012.
For buyers, the practical question is what a home costs to own comfortably. Purchase price, financing, insurance, property taxes, and any HOA dues all belong in that conversation.
More Competition for Sellers
Active listings increased by 171 homes in two weeks to 15,003. Inventory is approximately 2% above last year, while pending-sales demand is lower.
With more listings competing for fewer buyers, the county’s Expected Market Time increased from 129 to 137 days, compared with 114 days a year ago.
Expected Market Time measures the relationship between active inventory and the current pending-sales pace. It is not the average days on market or a prediction of how long a particular home will take to sell.
Property Type and Price Range Matter
The countywide numbers tell only part of the story. Expected Market Time for detached homes was 117 days, compared with 188 days for condominiums and townhomes.
The luxury segment, defined in this report as homes above $2 million, had an Expected Market Time of 258 days. Even within luxury, the pace varied considerably by price range.
For a seller, that makes nearby comparable properties, competing listings, condition, and presentation especially important. A countywide headline cannot replace an analysis of your specific home.
What This Means for Buyers and Sellers
For buyers: A slower market can create room to negotiate, particularly on listings that have been available longer. Focus on a sustainable monthly payment and evaluate each property carefully. Waiting for a repeat of 2008 is a strategy built on an uncertain assumption.
For sellers: Price against today’s alternatives and recent comparable sales. Thoughtful preparation, strong photography, and a clear marketing plan help buyers recognize value. If interest is limited, review showing feedback and competing listings early.
Looking Ahead
The report expects elevated inventory to persist through the autumn before the typical holiday-season reduction in listings. Mortgage rates remain an important influence on buyer activity, and future price changes are uncertain.
My approach is to start with the data, then connect it to your neighborhood, your property, and your priorities.
Thinking About Buying or Selling?
Whether you’re considering a move or simply curious about your home’s value, I’d be happy to help you understand your options and create a strategy that fits your goals.
Hamid Koochak | Compass Broker Associate | CA DRE# 01926949
Source: Steven Thomas, Reports On Housing, “Los Angeles County Housing Report: Then and Now—2008 vs. Today,” dated September 28, 2026. Figures reflect the report’s stated periods. Market conditions vary by neighborhood, property type, and price range.
View the publicly shareable market charts · View the publicly shareable report summary