Housing Insanity Returns
With the number of available homes to purchase at extremely low levels, there simply are too many buyers competing against each other despite high mortgage rates.
A Seller’s Market
When the Expected Market Time drops below 60 days, the housing market leans in favor of sellers.
A three-bedroom, two-and-a-half bathroom, 2,100 square foot home on a 3,700 square foot lot, built in 2003, was placed on the market on the second Tuesday of March at $1,099,000. There was a steady stream of buyers during a three-hour window on Saturday and a two-hour window on Sunday. By Monday evening, more than 20 offers were submitted to the listing agent. The seller countered all offers and asked them to return with their highest and best price. The home closed during the second week of April at $1,145,000, an astonishing 4% above its list price.
Not every home sells above the asking price, especially in today’s high mortgage rate environment. The sales-to-list price ratio for all homes priced below $2 million so far in April is 99.9%. For luxury homes, anything priced above $2 million (the top 10% of closings), it drops to 94.6%. The median time on the market is nine days, a little over a week. It would probably be even faster, but there are too many offers for many sellers to sift through.
Active Listings
The active listing inventory in the past couple of weeks decreased by 282 homes, down 4%, and now sits at 6,778 homes, its lowest level since April of last year. In March, 29% fewer homes came on the market compared to the 3-year average before COVID (2017 to 2019), 2,119 less. Last year, there were 5,760 homes on the market, 1,018 fewer homes, or 15% less. The 3-year average before COVID (2017 to 2019) was 11,342, or 67% more.
Demand
Demand, the number of pending sales over the prior month, increased by 217 pending sales in the past two weeks, up 6%, and now totals 3,964. Last year, there were 5,475 pending sales, 38% more than today. The 3-year average before COVID (2017 to 2019) was 5,893, or 49% more.
Los Angeles County Housing Summary
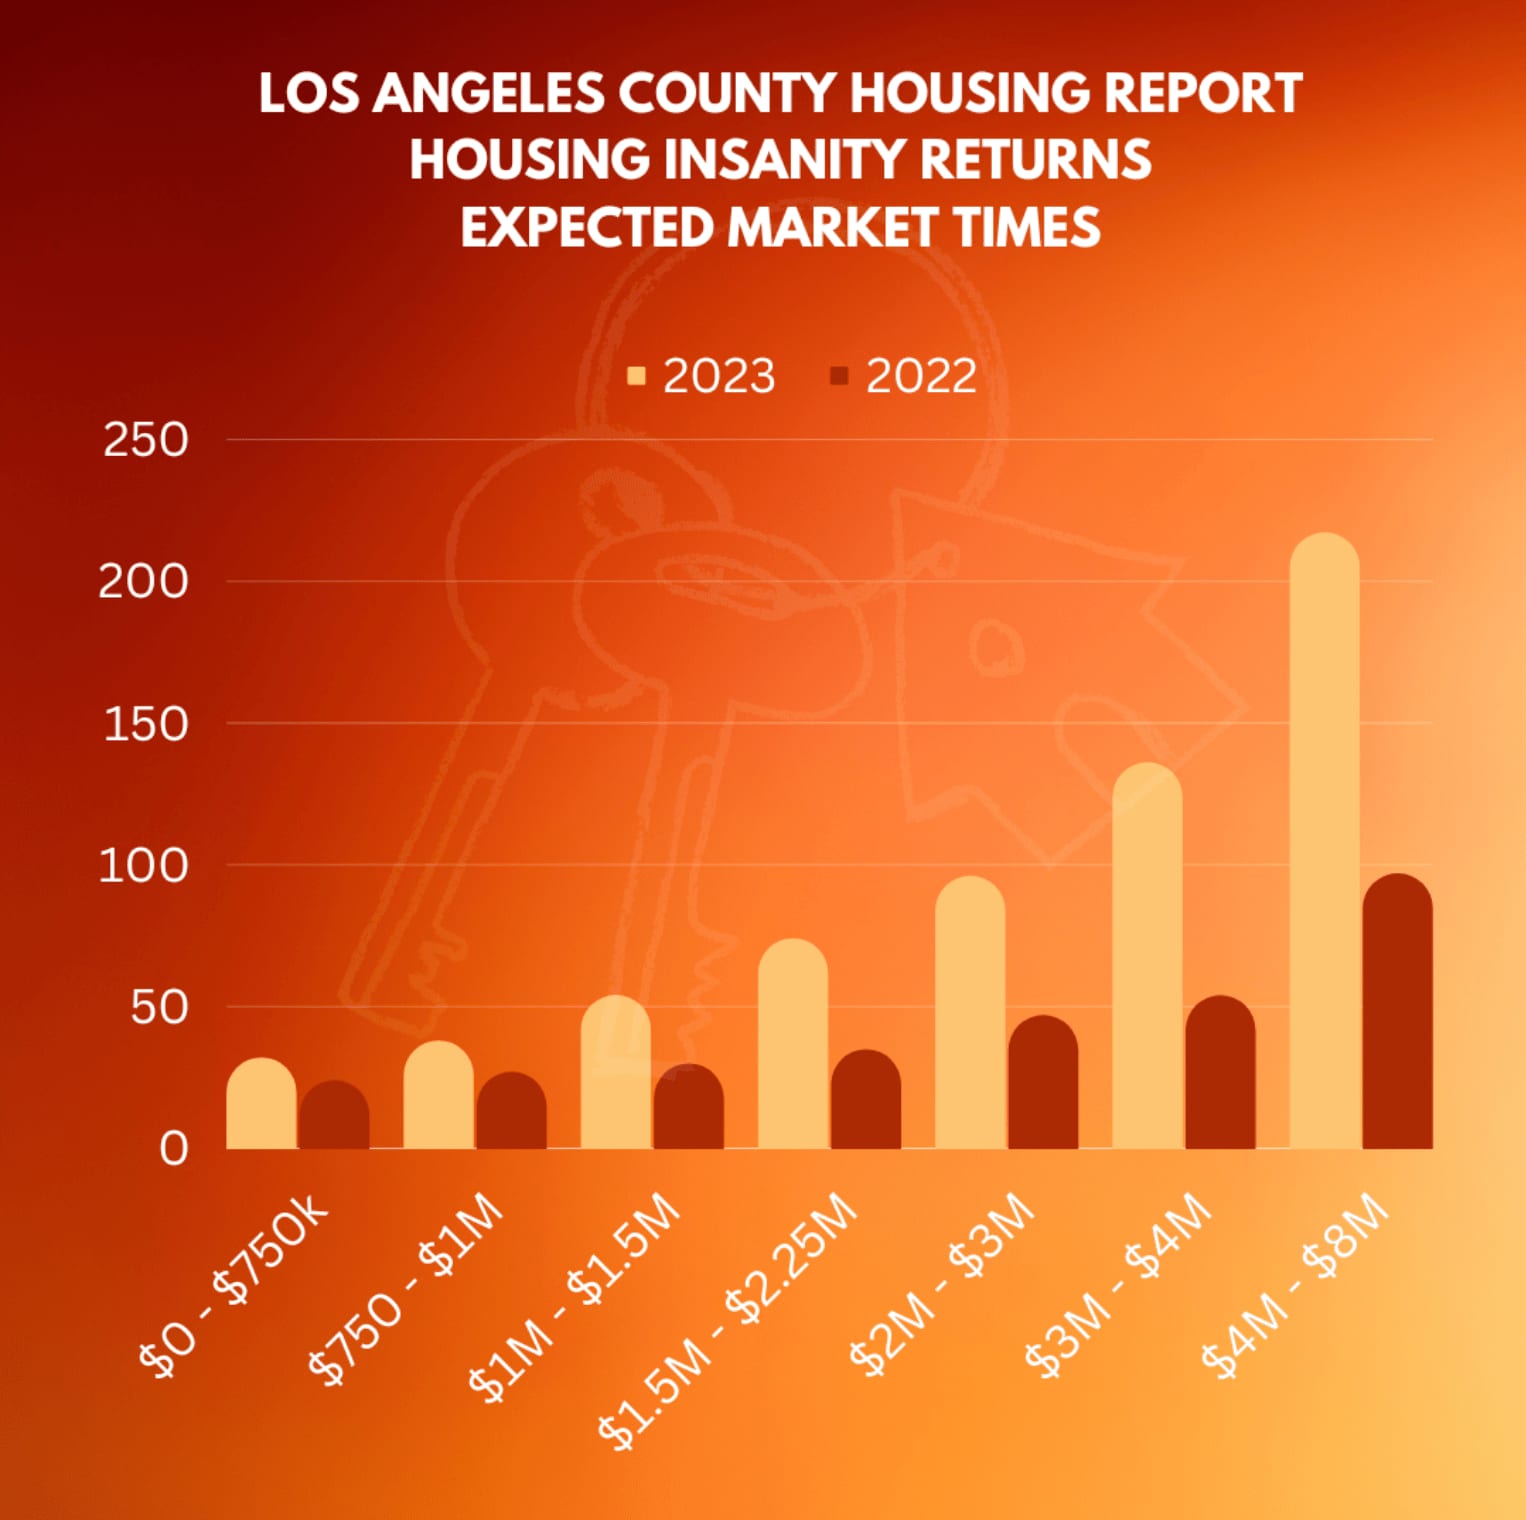
- With supply falling and demand rising, the Expected Market Time, the number of days to sell all Los Angeles County listings at the current buying pace, plunged from 57 to 51 days in the past couple of weeks. It was 32 days last year, much stronger than today.
- For homes priced below $750,000, the Expected Market Time decreased from 38 to 32 days in the past couple of weeks. This range represents 29% of the active inventory and 47% of demand.
- For homes priced between $750,000 and $1 million, the Expected Market Time decreased from 45 to 38 days. This range represents 17% of the active inventory and 23% of demand.
- For homes priced between $1 million to $1.5 million, the Expected Market Time remained unchanged at 54 days. This range represents 15% of the active inventory and 14% of demand.
- For homes priced between $1.5 million to $2 million, the Expected Market Time increased from 73 to 74 days. This range represents 10% of the active inventory and 7% of demand.
- For homes priced between $2 million and $3 million, the Expected Market Time in the past couple of weeks remained unchanged at 96 days. For homes priced between $3 million and $4 million, the Expected Market Time remained unchanged at 136 days. For homes priced between $4 million and $8 million, the Expected Market Time decreased from 276 to 217 days. For homes priced above $8 million, the Expected Market Time decreased from 1,341 to 1,302 days.
- The luxury end, all homes above $2 million, account for 29% of the inventory and 9% of demand.
- Distressed homes, both short sales and foreclosures combined, made up only 0.9% of all listings and 0.6% of demand. Only 41 foreclosures and 21 short sales are available to purchase today in all of Los Angeles County, 62 total distressed homes on the active market, up six in the past two weeks. Last year there were 23 total distressed homes on the market, slightly fewer than today.
- There were 4,184 closed residential resales in March, 31% less than March 2022’s 6,091 closed sales. March marked a 47% increase compared to February 2023. The sales-to-list price ratio was 100.4% for all of Los Angeles County. Foreclosures accounted for just 0.5% of all closed sales, and short sales accounted for 0.1%. That means that 99.4% of all sales were good ol’ fashioned sellers with equity.