Los Angeles Housing Market: A Strange Start to 2025
The Los Angeles County housing market is behaving in ways we typically don’t see at the start of the year. Instead of the usual January uptick in buyer activity, the market has slowed dramatically, with homes taking longer to sell and inventory levels rising at an unprecedented pace.
Unexpected Slowdown
January usually brings renewed energy to the real estate market as buyers return and sellers list their homes. However, this year, the opposite happened—homes are sitting on the market longer, and the Expected Market Time (how long it takes to sell all current listings) has surged higher. This shift is surprising, considering past trends have shown a drop in market time at this stage.
Why is This Happening?
- More Sellers Are Listing: Homeowners who were previously “hunkering down” due to low locked-in mortgage rates are finally putting their homes on the market, increasing inventory at the fastest pace in over a decade.
- Buyers Are Holding Back: Demand has barely moved, weighed down by mortgage rates hovering above 7%. High borrowing costs are making affordability a major challenge, pushing many buyers to the sidelines.
- Luxury Market Remains Slow: High-end homes are taking even longer to sell, with the top-tier market struggling due to an oversupply and weak demand.
What’s Next?
Historically, demand picks up from now through mid-March, and that trend should continue—though it may be muted compared to past years. The key factor remains mortgage rates. If they stay high, inventory will likely continue to rise, making this a slower-than-usual market for sellers. However, buyers who stay active may benefit from having more options and potential room for negotiation.
Los Angeles County Housing Summary
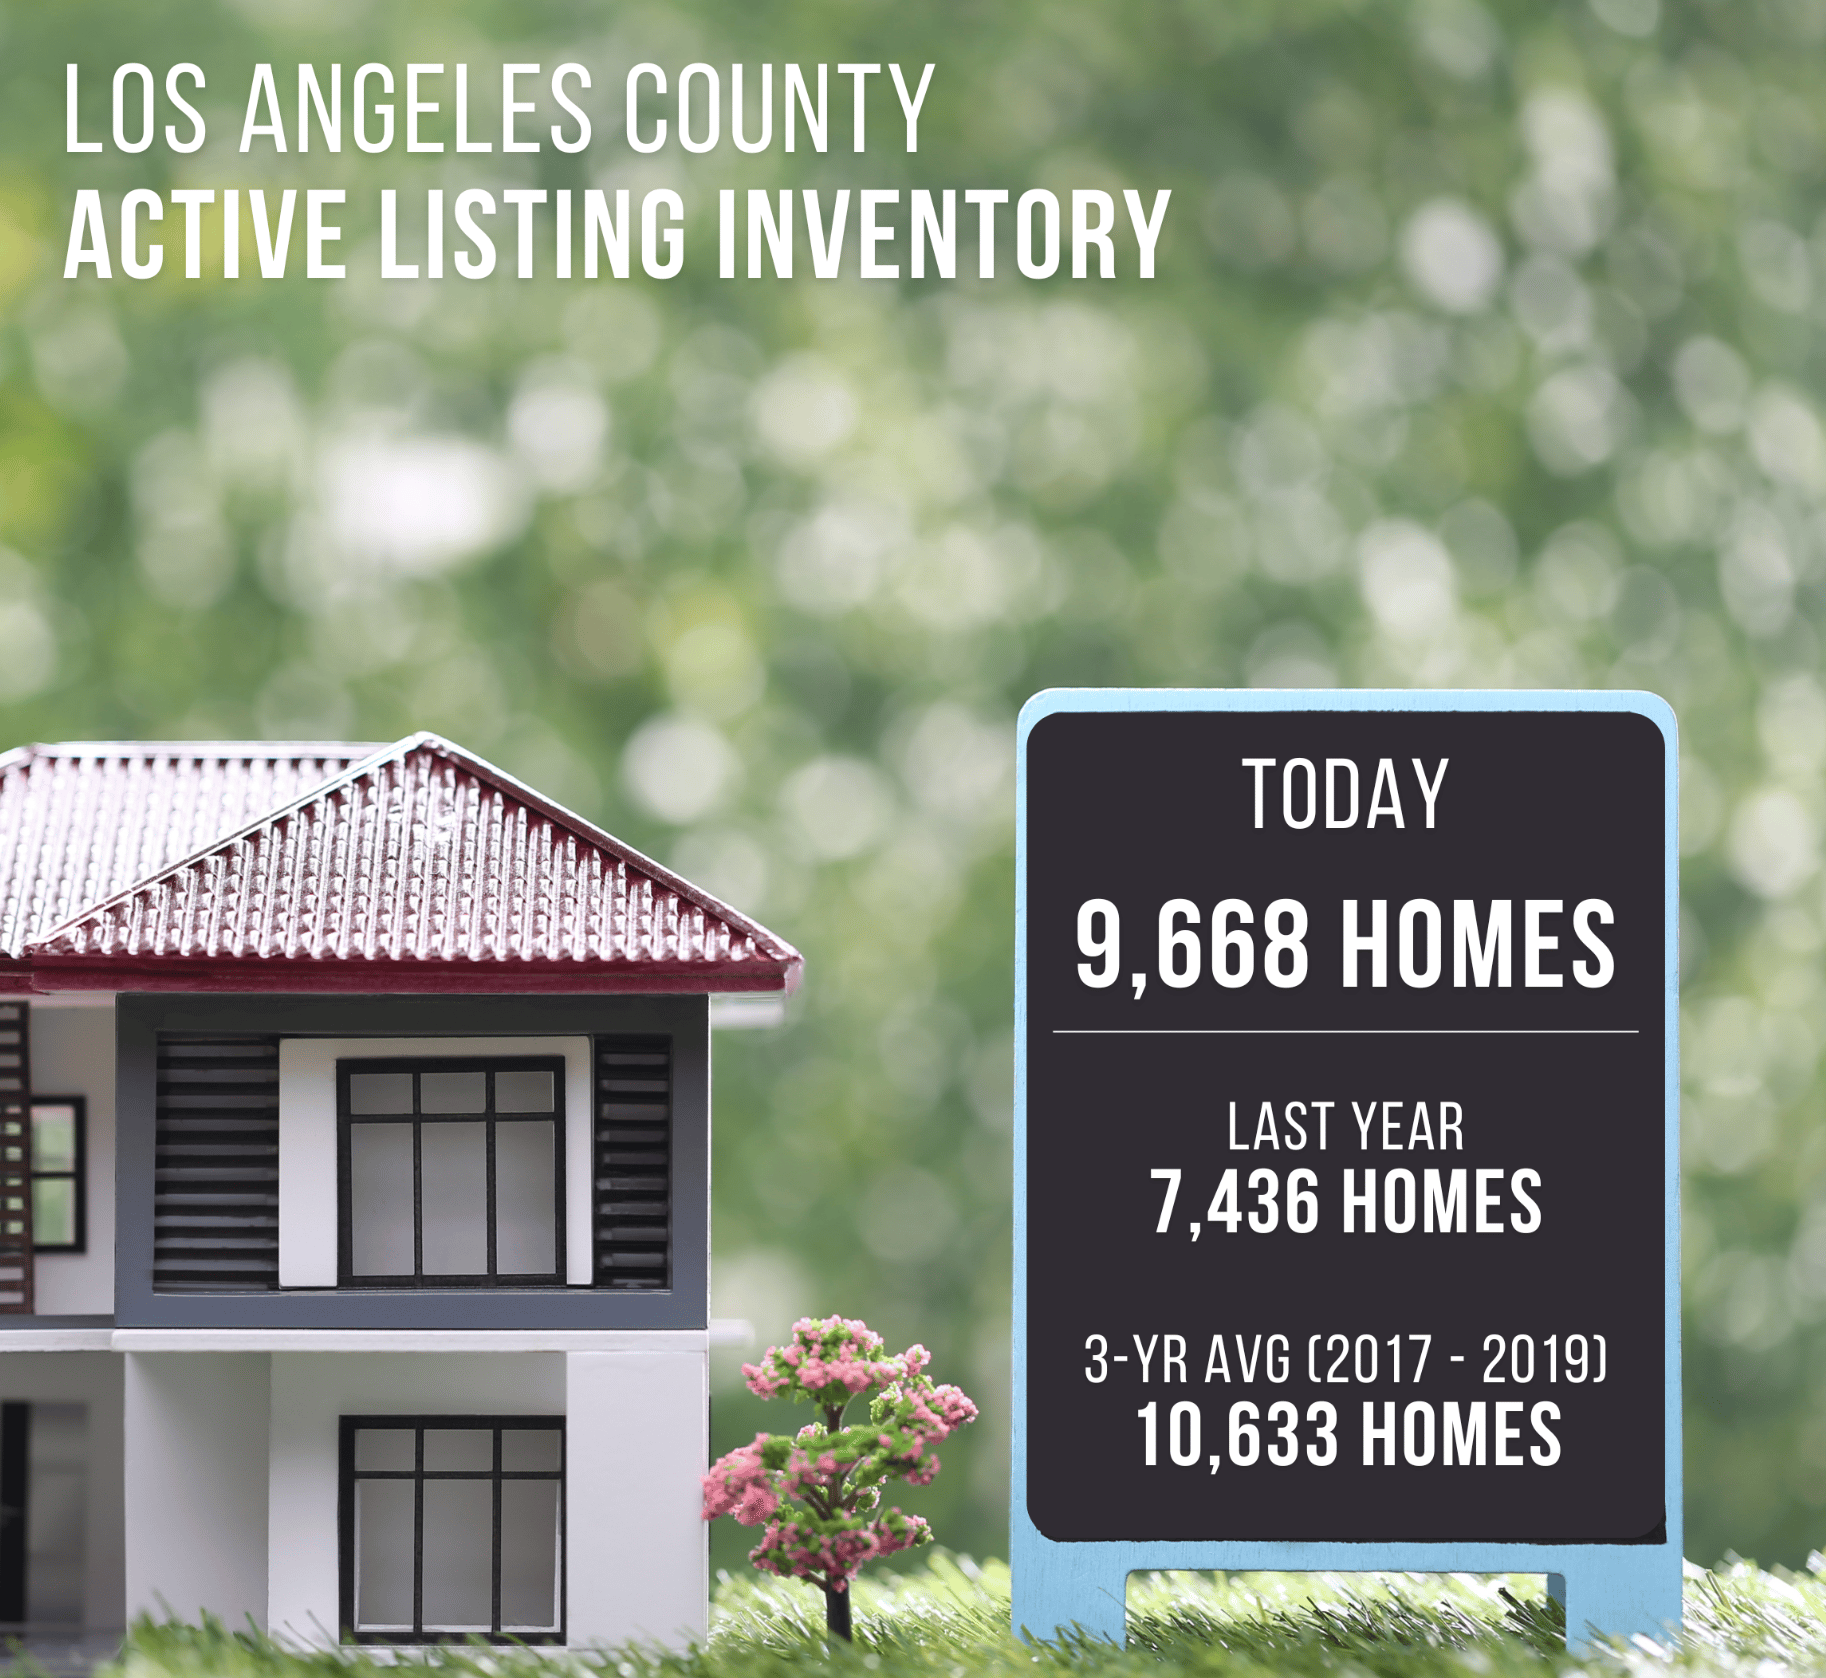
- The active listing inventory in the past couple of weeks surged higher by 1,135 homes, up 13%, and now sits at 9,668 homes, its largest two-week rise since tracking began in 2012. In December, 9% fewer homes came on the market compared to the 3-year average before COVID (2017 to 2019), 307 less. Yet, 463 more sellers came on the market this December compared to December 2023. Last year, there were 7,436 homes on the market, 2,232 fewer homes, or 23% less. The 3-year average before COVID (2017 to 2019) was 10,633, or 10% more.
- Demand, the number of pending sales over the prior month, decreased by 187 pending sales in the past two weeks, down 8%, and now totals 2,303, its second lowest level for mid-January since tracking began in 2012, only behind 2023’s 2,269. Last year, there were 2,442 pending sales, 6% more. The 3-year average before COVID (2017 to 2019) was 3,663, or 59% more.
- With inventory climbing substantially and demand falling, the Expected Market Time, the number of days to sell all Los Angeles County listings at the current buying pace, increased from 103 to 126 days in the past couple of weeks, its highest level since January 2019. It was 91 days last year, substantially faster than today. The 3-year average before COVID (2017 to 2019) was 90 days, much faster than today.
- In the past couple of weeks, the Expected Market Time for homes priced below $750,000 increased from 83 to 97 days. This range represents 30% of the active inventory and 39% of demand.
- The Expected Market Time for homes priced between $750,000 and $1 million increased from 79 to 93 days. This range represents 20% of the active inventory and 27% of demand.
- The Expected Market Time for homes priced between $1 million and $1.5 million increased from 90 to 121 days. This range represents 17% of the active inventory and 17% of demand.
- The Expected Market Time for homes priced between $1.5 million and $2 million increased from 140 to 195 days. This range represents 10% of the active inventory and 6% of demand.
- In the past two weeks, the Expected Market Time for homes priced between $2 million and $3 million increased from 170 to 231 days. The Expected Market Time for homes priced between $3 million and $4 million increased from 191 to 206 days. The Expected Market Time for homes priced between $4 million and $8 million decreased from 363 to 311 days. The Expected Market Time for homes priced above $8 million decreased from 730 to 722 days.
- The luxury end, all homes above $2 million, account for 24% of the inventory and 11% of demand.
- Distressed homes, both short sales and foreclosures combined, made up only 1% of all listings and 1.1% of demand. Only 61 foreclosures and 33 short sales are available to purchase today in all of Los Angeles County, with 94 total distressed homes on the active market, unchanged from two weeks ago. Last year, there were 60 total distressed homes on the market, slightly fewer than today.
- There were 3,806 closed residential resales in December, up 16% compared to December 2023’s 3,269 closed sales and up 5% from November 2024. The sales-to-list price ratio was 98.9% for all of Los Angeles County. Foreclosures accounted for just 0.4% of all closed sales, and short sales accounted for 0.1%. That means that 99.5% of all sales were good ol’ fashioned sellers with equity.
As always, those looking to buy or sell should keep a close eye on market shifts, as 2025 is shaping up to be anything but predictable. I’m here to guide you every step of the way!