Los Angeles County Housing Market Update – May 2025
Relying on the Facts
In a world flooded with housing crash headlines and viral TikToks predicting doom, it’s time to hit pause and look at what the data actually says about the Los Angeles housing market.
Myth vs. Reality
-
MYTH 1: “The market is flooded with listings”
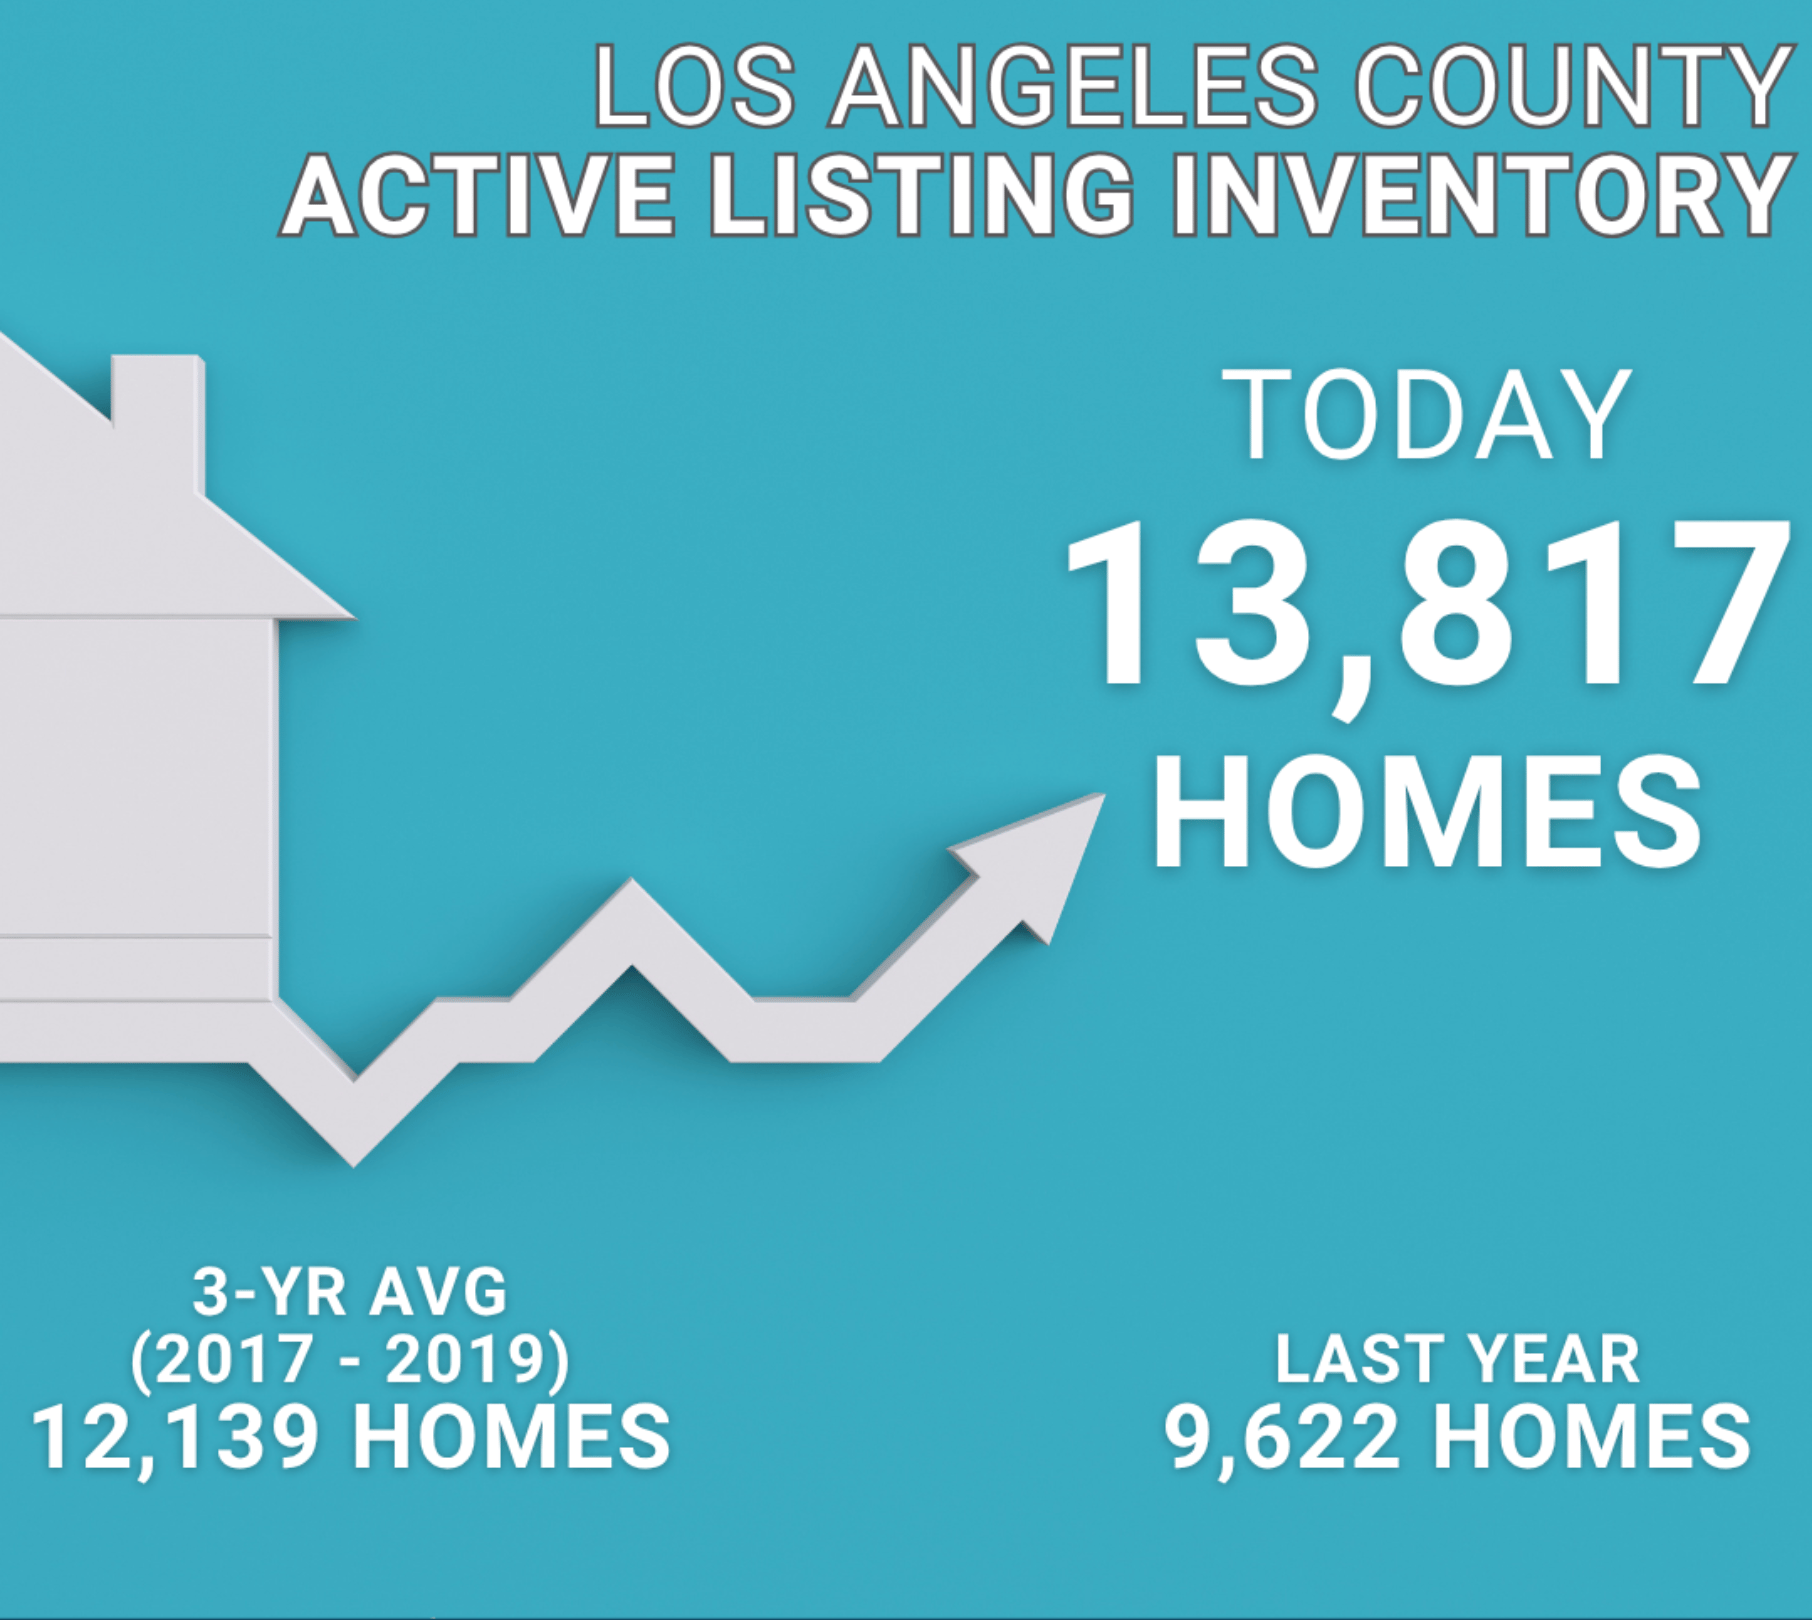
REALITY: Inventory is up—13,817 homes in LA County, 44% higher than last year—but still far below pre-2008 and even pre-COVID norms. Limited supply continues to support home values. -
MYTH 2: “Prices are about to plunge”
REALITY: Home values may flatten or slightly dip due to growing inventory and stagnant demand, but don’t expect a crash. Prices are up 3% year-over-year, and today’s homeowners are financially stronger than ever before. -
MYTH 3: “Nobody is selling because they’re locked into low rates”
REALITY: More homeowners are listing despite higher rates. LA County saw 21% more listings year-over-year through April—proof that life moves people, not just interest rates. -
MYTH 4: “Wait for the perfect moment to buy”
REALITY: Timing the market rarely works. Small changes in interest rates can quickly shift buyer demand. If you’re financially ready, waiting might cost you more long-term.
Note from Hamid:
Ignore the hype and follow the data. The market is slowly normalizing—not crashing. Inventory is rising, but still tight by historical standards. Prices are holding, not tumbling. And while mortgage rates remain a headwind, buyers and sellers alike are adjusting.
Los Angeles County Housing Summary
- INVENTORY: The active listing inventory in the past couple of weeks increased by 342 homes, up 3%, and now sits at 13,817, its highest level since August 2019. Last year, there were 9,622 homes on the market, 4,195 fewer homes, or 30% less. The 3-year average before COVID (2017-2019) was 12,139, which is 12% lower. From January through April, 11% fewer homes came on the market compared to the 3-year average before COVID (2017-2019), 3,335 less. Yet, 4,957 more sellers came on the market than in the same period last year, and 8,378 more compared to 2023.
- DEMAND: Buyer demand, the number of pending sales over the prior month, increased by 169 pending sales in the past two weeks, up 5%, and now totals 3,885. Last year, there were 3,972 pending sales, 2% more. The 3-year average before COVID (2017-2019) was 5,990, which is 54% higher.
- MARKET TIME: With demand rising faster than supply, the Expected Market Time, the number of days to sell all Los Angeles County listings at the current buying pace, fell from 109 to 107 days in the past couple of weeks, its first decline since mid-March. Last year, it was 73 days, substantially faster than today. The 3-year average before COVID (2017-2019) was 62 days, which is also much quicker than today.
- LUXURY: In the past two weeks, the Expected Market Time for homes priced between $2 million and $3 million decreased from 163 to 137 days. The Expected Market Time for homes priced between $3 million and $4 million increased from 283 to 284 days. The Expected Market Time for homes priced between $4 million and $8 million increased from 280 to 284 days. The Expected Market Time for homes priced above $8 million decreased from 1,083 to 783 days.
- DISTRESSED HOMES: Short sales and foreclosures combined, comprised only 0.7% of all listings and 0.7% of demand. There are 53 foreclosures and 38 short sales available today in Los Angeles County, with a total of 91 distressed homes on the active market, unchanged from two weeks ago. Last year, 54 distressed homes were on the market, slightly fewer than today.
- CLOSED SALES: There were 4,314 closed residential resales in April, up 4% compared to April 2024’s 4,136 and 16% from March 2025. The sales-to-list price ratio was 100.3% for Los Angeles County. Foreclosures accounted for 0.4% of all closed sales, and short sales accounted for 0.1%. That means that 99.5% of all sales were sellers with equity.
If you're thinking about buying or selling, it's more important than ever to rely on facts, not fear. Let's connect!