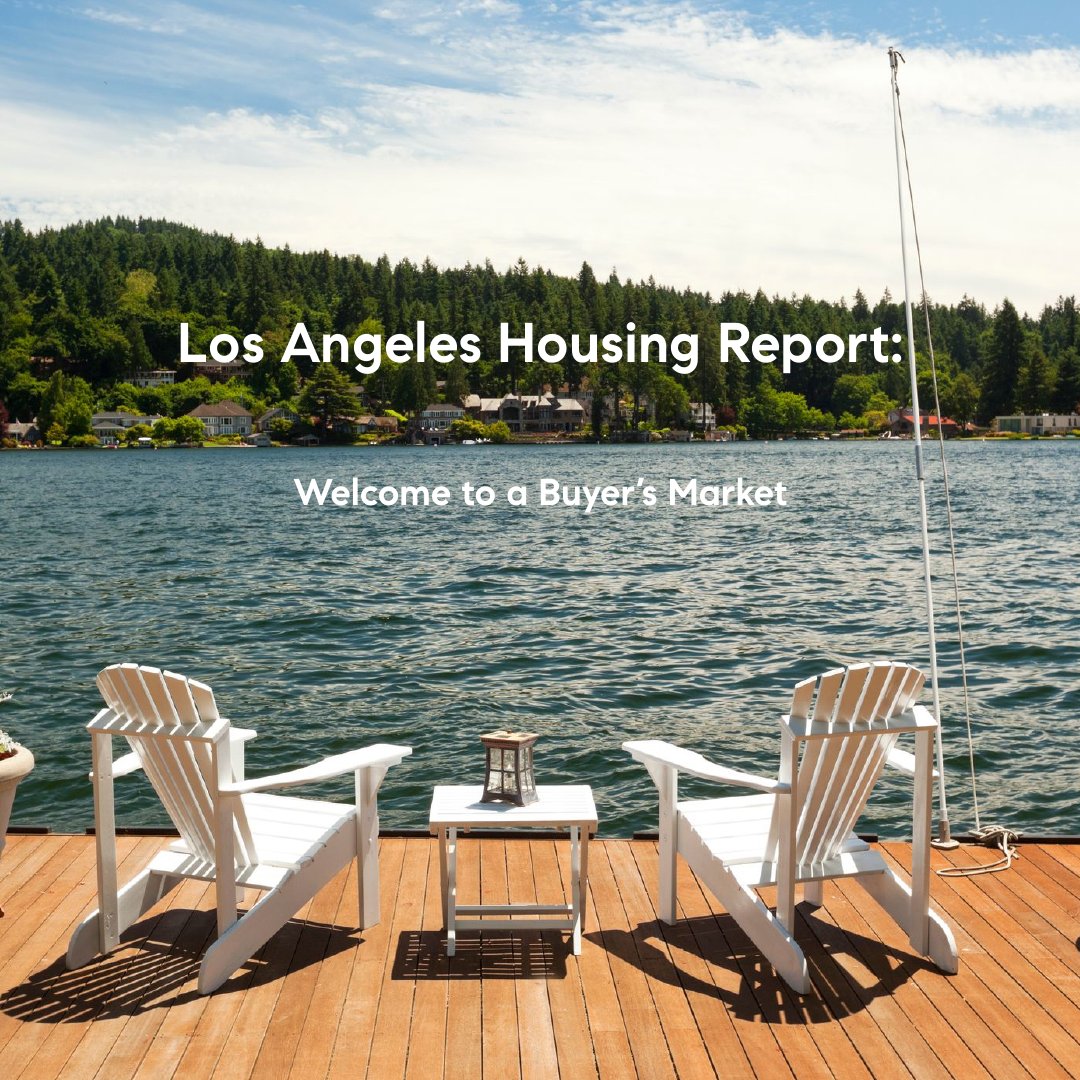
Welcome to a Buyer’s Market
For the first time in over a decade, the Los Angeles County housing market has officially shifted in favor of buyers, making this the slowest June since tracking began in 2012.
Here’s what’s happening:
Inventory Up, Demand Flat
Housing inventory has climbed by 41% year-over-year, giving buyers far more choices than in recent years. Meanwhile, buyer demand has remained essentially flat, creating a significant shift in the market dynamic.
Longer Selling Times
The Expected Market Time—how long it would take to sell all active listings at the current pace—has grown by 45% compared to last year, and it's nearly double what it was two years ago. This is the longest market time seen in June in over a decade.
Price Cuts & Motivated Sellers
-
34% of active listings have reduced their asking price.
-
The number of sellers pulling their homes off the market has surged by 87% compared to last year.
-
Sellers are far more open to negotiating than they’ve been in years.
What’s Happening to Prices?
While some buyers are holding out for big price drops, that’s not expected.
-
Home values are up 1.0% year-over-year, but down 0.6% month-over-month.
-
Prices will likely drift slowly down through the rest of the year, but not crash. Most homeowners have strong equity, fixed low-rate mortgages, or own their homes outright—there’s little financial pressure to sell at a loss.
Market Advice:
Buyers:
Now is a good time to act. With more inventory, less competition, and growing seller flexibility, buyers have room to negotiate. Waiting for steep price declines may be a losing strategy.
Sellers:
Today’s market demands accurate pricing from day one. Homes that are overpriced don’t sell. The best chance to capture attention is right when your home hits the market—don't miss that window.
Los Angeles County Housing Summary
- INVENTORY: The active listing inventory in the past couple of weeks increased by 502 homes, up 3%, and now sits at 14,882, its highest June level since tracking began in 2012. Last year, there were 10,547 homes on the market, 4,335 fewer homes, or 29% less. The 3-year average before COVID (2017-2019) was 12,885, which is 13% lower. From January through May, 12% fewer homes came on the market compared to the 3-year average before COVID (2017-2019), 4,888 less. Yet, 5,507 more sellers came on the market this year than last, and 10,167 more compared to 2023.
- DEMAND: Buyer demand, the number of pending sales over the prior month, decreased by 58 pending sales in the past two weeks, down 1%, and now totals 3,850. Last year, there were 3,932 pending sales, 2% more. The 3-year average before COVID (2017-2019) was 5,789, which is 50% higher.
- MARKET TIME: With supply rising and demand falling, the Expected Market Time, the number of days to sell all Los Angeles County listings at the current buying pace, increased from 110 to 116 days in the past couple of weeks, its highest level since mid-January. Last year, it was 79 days, substantially faster than today. The 3-year average before COVID (2017-2019) was 65 days, which is also much quicker than today.
- LUXURY: In the past two weeks, the Expected Market Time for homes priced between $2 million and $3 million increased from 136 to 149 days. The Expected Market Time for homes priced between $3 million and $4 million decreased from 210 to 209 days. The Expected Market Time for homes priced between $4 million and $8 million increased from 276 to 322 days. The Expected Market Time for homes priced above $8 million increased from 737 to 849 days.
- DISTRESSED HOMES: Short sales and foreclosures combined, comprised only 0.6% of all listings and 0.8% of demand. There are 58 foreclosures and 38 short sales available today in Los Angeles County, with a total of 96 distressed homes on the active market, up one from two weeks ago. Last year, 58 distressed homes were on the market, slightly fewer than today.
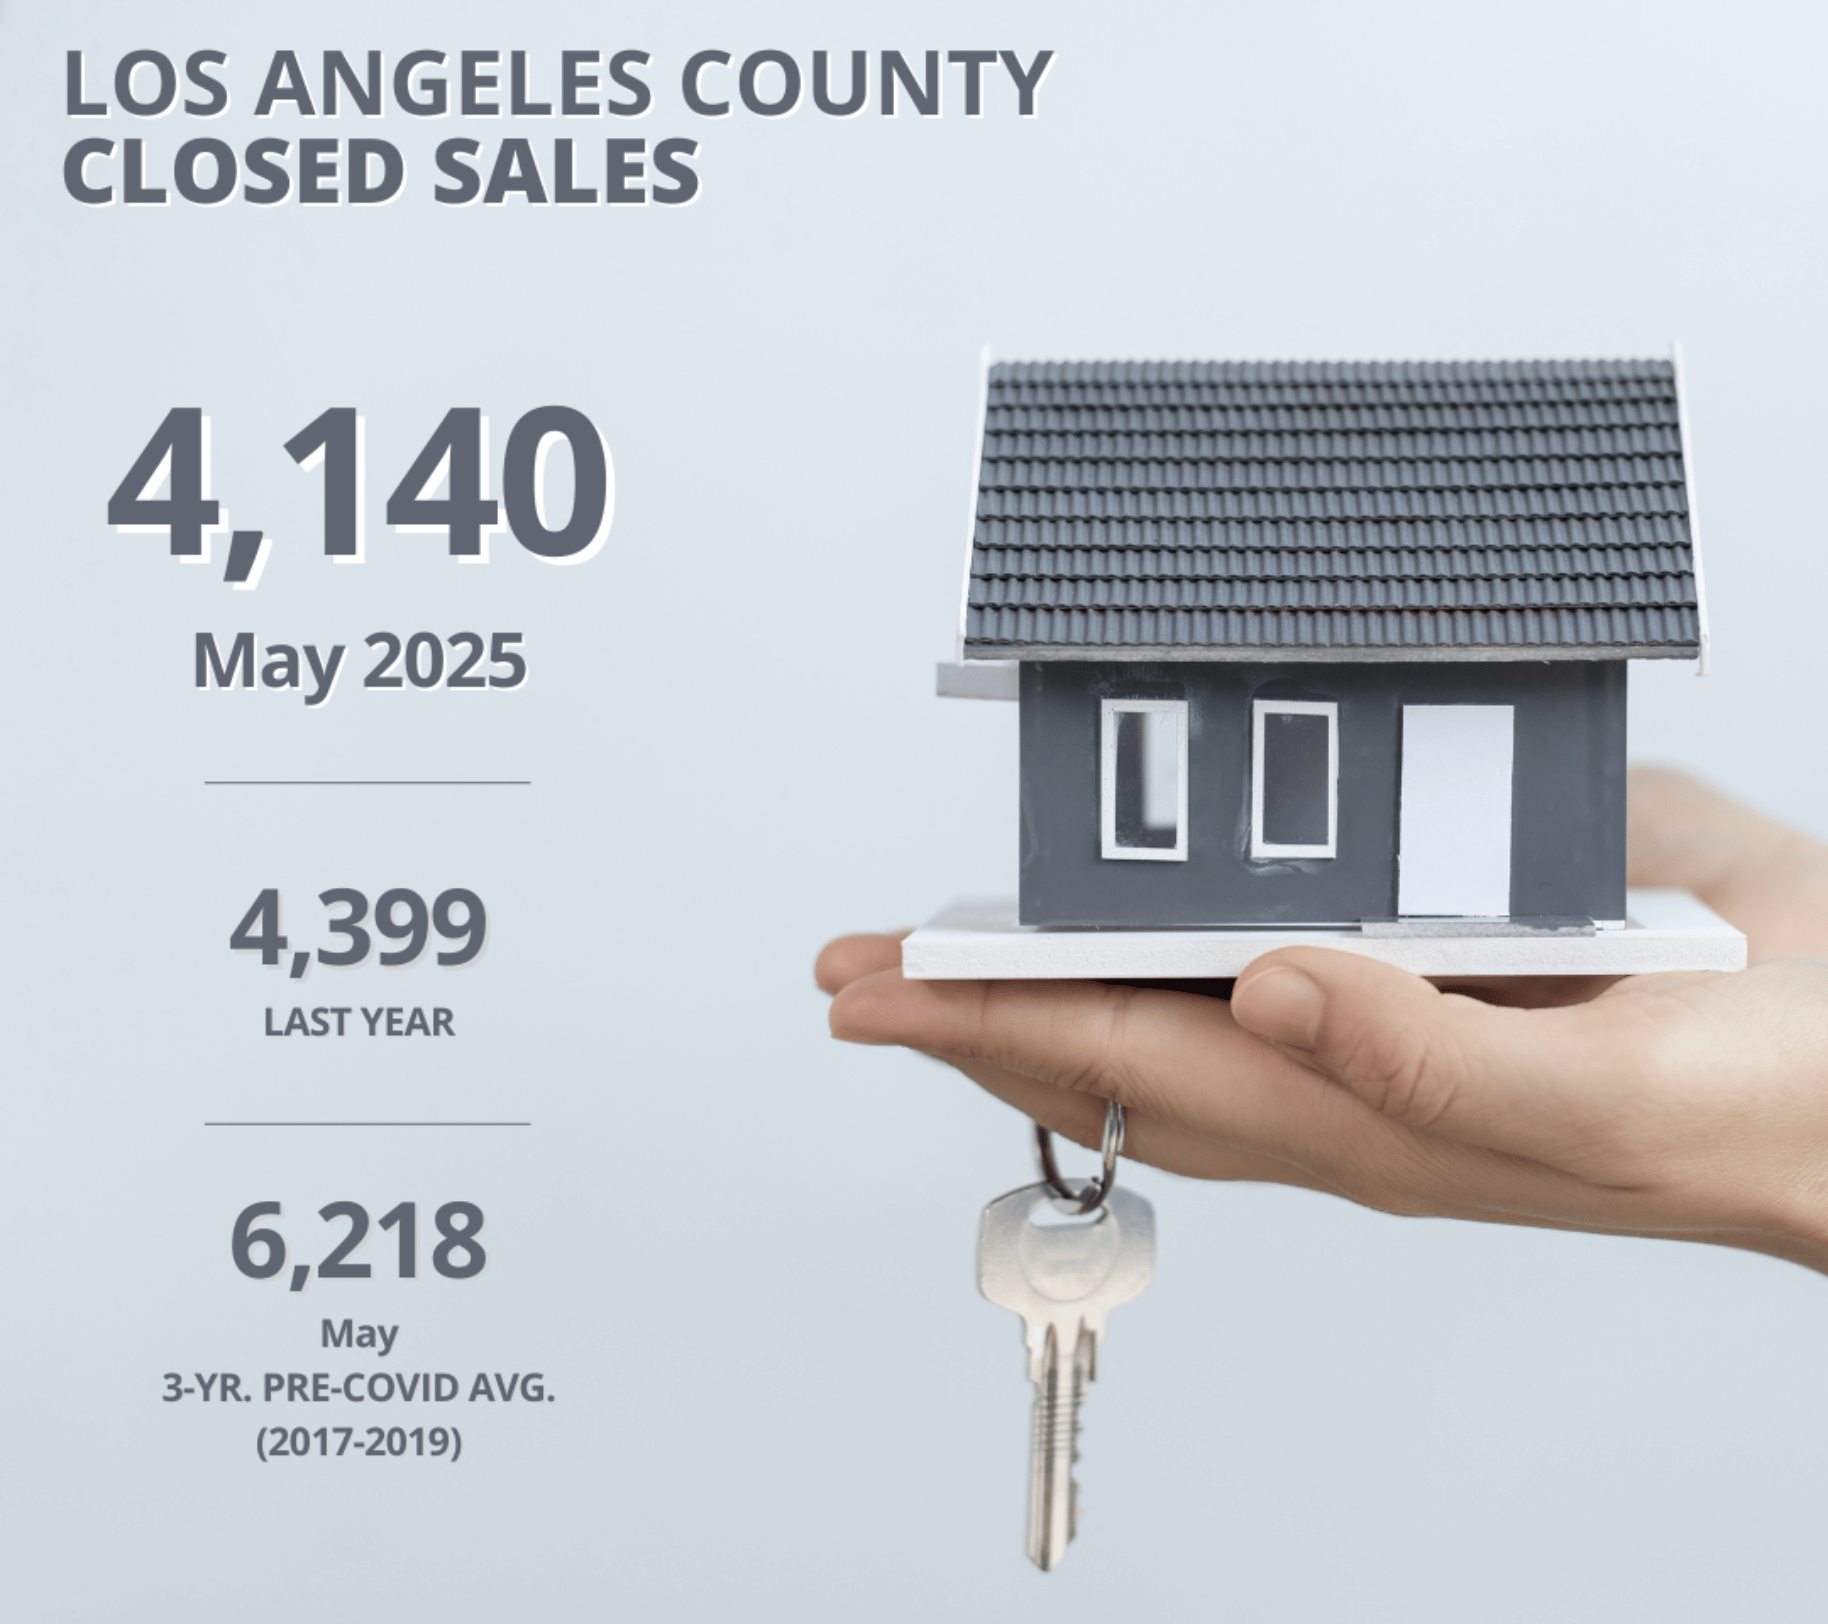
- CLOSED SALES: There were 4,140 closed residential resales in May, down 6% compared to May 2024’s 4,394 and down 4% from April 2025. The sales-to-list price ratio was 99.5% for Los Angeles County. Foreclosures accounted for 0.5% of all closed sales, and short sales accounted for 0.2%. That means that 99.3% of all sales were sellers with equity.
Every neighborhood tells a different story.
While this report gives a snapshot of the broader Los Angeles market, real estate is always local. If you're curious about what's happening in your specific neighborhood—or want tailored advice for your next move—reach out anytime.
📞 Let’s talk about how this market shift impacts you and how I can help you navigate it confidently.