Orange County Housing Market: A Strange Start to 2025
The Orange County housing market is seeing an unusual slowdown at the start of the year. Instead of the typical seasonal uptick in buyer activity, the market is cooling off, with homes taking longer to sell and inventory levels rising at an unprecedented pace.
Unexpected Slowdown
Normally, January brings increased demand and a faster-moving market, but this year, the opposite is happening. The Expected Market Time (how long it takes to sell all current listings) has jumped from 76 to 84 days in just two weeks—an unusual trend considering past years have typically seen market time drop during this period.
Why is This Happening?
- More Sellers Are Listing: Homeowners who have been holding off due to low fixed mortgage rates are now listing their homes at the fastest pace in over a decade, leading to a 15% surge in inventory in just two weeks.
- Buyers Are Hesitant: Demand has remained weak, growing by just 4%, despite the increase in available homes. High mortgage rates—hovering above 7%—continue to make affordability a challenge.
- Luxury Market Faces a Shift: The high-end market is seeing significant changes. The luxury price threshold has now been raised to $2.5 million and above, reflecting the overall price growth in the county. Despite this shift, lu
- xury homes are taking longer to sell, with market time for homes above $6 million now stretching to 595 days—meaning some properties may not go under contract until late 2026.
What’s Next?
Demand is expected to rise in the coming weeks as the market transitions into the Winter Market (January through mid-March). However, with more homes hitting the market, inventory will likely continue to grow, preventing the usual sharp decline in market time.
The biggest factor to watch? Mortgage rates. If they remain above 7%, sellers may face longer wait times, while buyers could see more opportunities and negotiating power. With Orange County’s market moving in unpredictable ways, those looking to buy or sell should stay informed and adjust their strategies accordingly.
Orange County Housing Summary
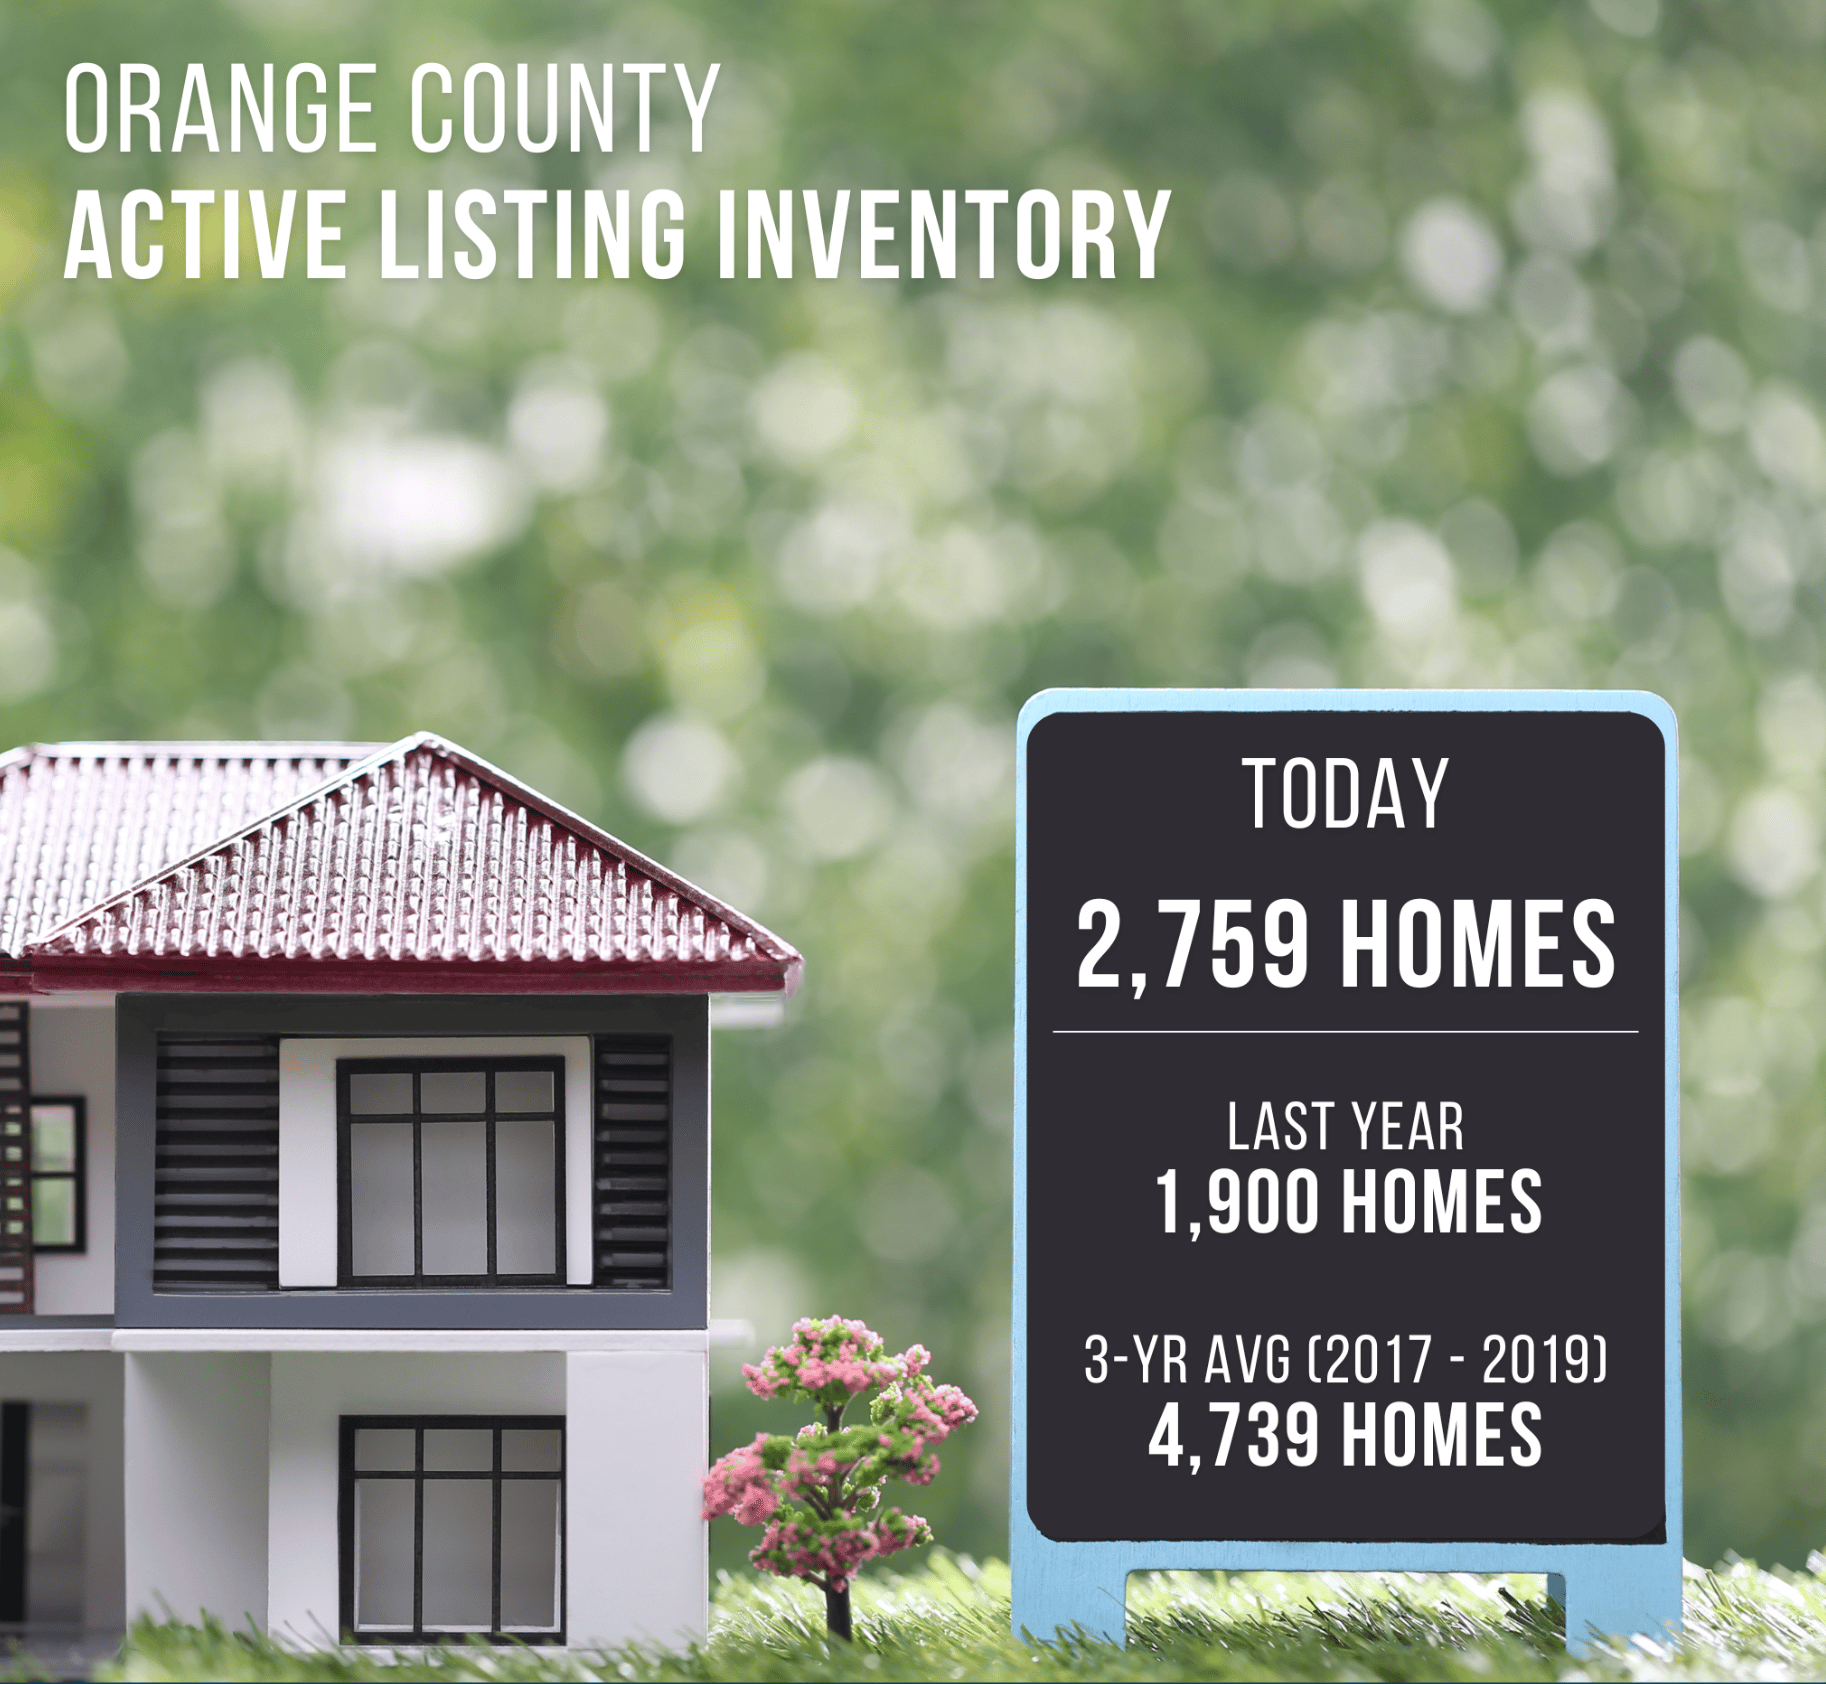
- The active listing inventory in the past couple of weeks surged higher by 358 homes, up 15%, and now sits at 2,759, its highest mid-January level since 2020. In December, 20% fewer homes came on the market compared to the 3-year average before COVID (2017 to 2019), 296 less. Yet, 175 more sellers came on the market this December compared to December 2023. Last year, there were 1,900 homes on the market, 859 fewer homes, or 31% less. The 3-year average before COVID (2017 to 2019) was 4,739, or 72% extra.
- Demand, the number of pending sales over the prior month, increased by 35 pending sales in the past two weeks, up 4%, and now totals 988, its second lowest level for mid-January since tracking began in 2004, only behind 2023’s 939. Last year, there were 1,010 pending sales, 2% more. The 3-year average before COVID (2017 to 2019) was 1,710, or 73% more.
- With the inventory surging higher compared to the slight rise in demand, the Expected Market Time, the number of days to sell all Orange County listings at the current buying pace, increased from 76 to 84 days in the past couple of weeks. Last year, it was 56 days, noticeably faster than today. The 3-year average before COVID (2017 to 2019) was 86 days, similar to today.
- In the past two weeks, the Expected Market Time for homes priced below $750,000 increased from 55 to 68 days. This range represents 19% of the active inventory and 24% of demand.
- The Expected Market Time for homes priced between $750,000 and $1 million increased from 56 to 58 days. This range represents 15% of the active inventory and 22% of demand.
- The Expected Market Time for homes priced between $1 million and $1.25 million increased from 51 to 69 days. This range represents 10% of the active inventory and 12% of demand.
- The Expected Market Time for homes priced between $1.25 million and $1.5 million increased from 54 to 63 days. This range represents 10% of the active inventory and 13% of demand.
- The Expected Market Time for homes priced between $1.5 million and $2 million decreased from 103 to 80 days. This range represents 13% of the active inventory and 13% of demand.
- The Expected Market Time for homes priced between $2 million and $2.5 million is 89 days. This range represents 6% of the active inventory and 6% of demand.
- The Expected Market Time for homes priced between $2.5 million and $4 million is 149 days. In the past two weeks, for homes priced between $4 million and $6 million, the Expected Market Time increased from 216 to 272 days. For homes priced above $6 million, the Expected Market Time increased from 294 to 595 days.
- The luxury end, all homes above $2 million, account for 27% of the inventory and 10% of demand.
- Distressed homes, both short sales and foreclosures combined, comprised only 0.2% of all listings and 0.6% of demand. Only three foreclosures and three short sales are available today in Orange County, with six total distressed homes on the active market, unchanged from two weeks ago. Last year, eight distressed homes were on the market, similar to today.
- There were 1,634 closed residential resales in December, up 25% compared to December 2023’s 1,310 and up 3% from November 2024. The sales-to-list price ratio was 99.5% for Orange County. Foreclosures accounted for 0.1% of all closed sales, and there were no short sales. That means that 99.9% of all sales were good ol’ fashioned sellers with equity.
Contact me for more information; I'm here to help.