Orange County Housing Market: More Seller Competition
The Orange County housing market is experiencing a surge in inventory, with active listings up 56% year-over-year, reaching 3,033 homes—the highest mid-February level since 2020. This increase is fueled by homeowners who had delayed selling due to low mortgage rates but are now recognizing that higher rates are here to stay. Despite the rising supply, demand remains relatively low, causing the Expected Market Time to reach 61 days, significantly slower than last year’s 42 days.
As the spring market approaches, even more homes are expected to hit the market, intensifying seller competition. Overpricing is risky, as buyers have more options and remain cautious due to high mortgage rates. While overall demand remains sluggish, the luxury market has seen an uptick, with homes priced above $2.5 million seeing a 21% increase in pending sales. With inventory continuing to rise, sellers must price strategically to attract buyers, while buyers can take advantage of increased choices heading into the busiest season of the year.
Orange County Housing Summary
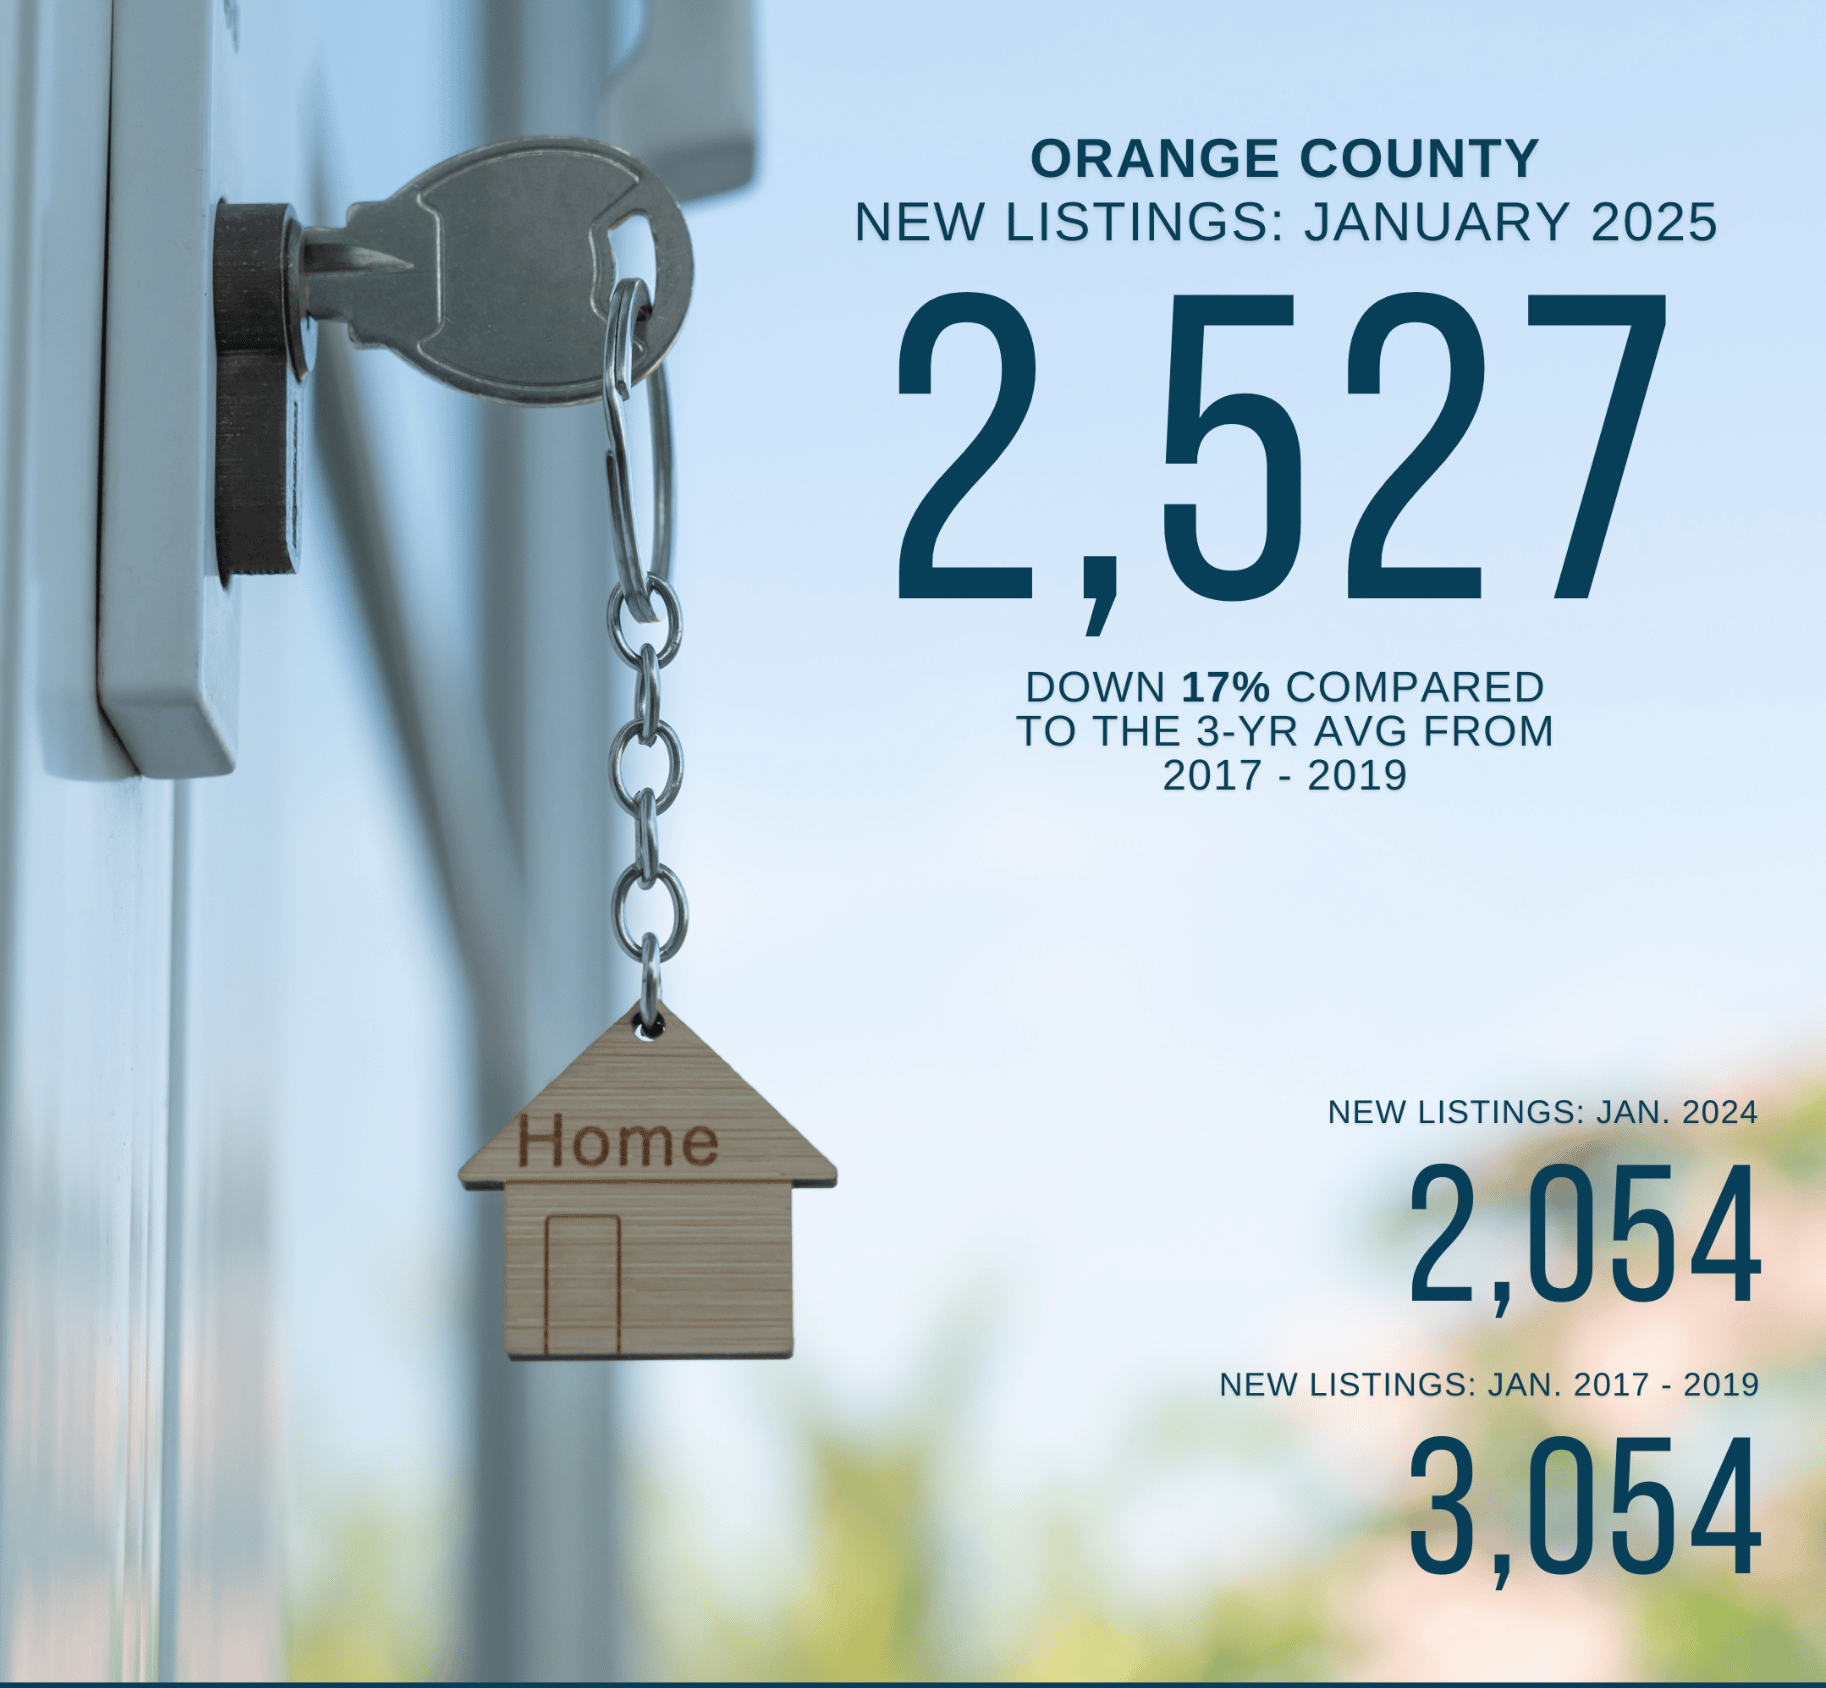
- The active listing inventory in the past couple of weeks increased by 212 homes, up 8%, and now sits at 3,033. In January, 17% fewer homes came on the market compared to the 3-year average before COVID (2017 to 2019), 528 less. Yet, 473 more sellers came on the market this January compared to January 2024. Last year, there were 1,939 homes on the market, 1,094 fewer homes, or 36% less. The 3-year average before COVID (2017 to 2019) was 4,977, or 64% extra.
- Demand, the number of pending sales over the prior month, surged by 157 pending sales in the past two weeks, up 12%, and now totals 1,497, its highest level since October. Last year, there were 1,397 pending sales, 7% less. The 3-year average before COVID (2017 to 2019) was 2,393, or 60% more.
- With demand rising faster than supply, the Expected Market Time, the number of days to sell all Orange County listings at the current buying pace, decreased from 63 to 61 days in the past couple of weeks. Last year, it was 42 days, noticeably faster than today. The 3-year average before COVID (2017 to 2019) was 64 days, similar to today.
- In the past two weeks, the Expected Market Time for homes priced below $750,000 decreased from 52 to 51 days. This range represents 18% of the active inventory and 22% of demand.
- The Expected Market Time for homes priced between $750,000 and $1 million decreased from 43 to 41 days. This range represents 14% of the active inventory and 20% of demand.
- The Expected Market Time for homes priced between $1 million and $1.25 million decreased from 49 to 46 days. This range represents 10% of the active inventory and 13% of demand.
- The Expected Market Time for homes priced between $1.25 million and $1.5 million decreased from 42 to 38 days. This range represents 9% of the active inventory and 14% of demand.
- The Expected Market Time for homes priced between $1.5 million and $2 million increased from 60 to 62 days. This range represents 13% of the active inventory and 13% of demand.
- The Expected Market Time for homes priced between $2 million and $2.5 million increased from 60 to 65 days. This range represents 6% of the active inventory and 7% of demand.
- In the past two weeks, the Expected Market Time for homes priced between $2.5 million and $4 million decreased from 132 to 112 days. For homes priced between $4 million and $6 million, the Expected Market Time decreased from 183 to 166 days. For homes priced above $6 million, the Expected Market Time decreased from 333 to 208 days.
- The luxury end, all homes above $2 million, account for 29% of the inventory and 12% of demand.
- Distressed homes, both short sales and foreclosures combined, comprised only 0.2% of all listings and 0.6% of demand. Only four foreclosures and two short sales are available today in Orange County, with six total distressed homes on the active market, up two from two weeks ago. Last year, nine distressed homes were on the market, similar to today.
- There were 1,268 closed residential resales in January, up 7% compared to January 2024’s 1,182 and down 22% from December 2024. The sales-to-list price ratio was 99.14% for Orange County. Short sales accounted for 0.1% of all closed sales, and there were no foreclosures. That means that 99.9% of all sales were good ol’ fashioned sellers with equity.
For information about your local market in Orange County, contact me.