No Flood of Foreclosures
Despite affordability challenges and a cooling job market, Los Angeles housing continues to show resilience. Many expect distressed sales to surge like in the Great Recession, but today’s market is far different. Tighter lending standards, strong homeowner equity, and historically low delinquency rates mean foreclosures remain a very small share of the market. Any recent uptick is simply a move back toward pre-pandemic “normal,” not a wave of distress.
Overall, inventory is easing lower heading into the holiday season, while demand has ticked up slightly thanks to mortgage rates dipping below recent highs. Market time has shortened but remains slower than last year and pre-COVID levels, showing buyers still face affordability headwinds.
The luxury market is steady, with supply and demand both edging higher compared to last year. Sellers in this segment are still facing longer timelines, though slight improvements are emerging at the very top end.
Bottom line: Los Angeles housing is adjusting to affordability pressures, but the strength of today’s homeowners and the lack of widespread distress continue to prevent a repeat of past crises.
Los Angeles County Housing Summary
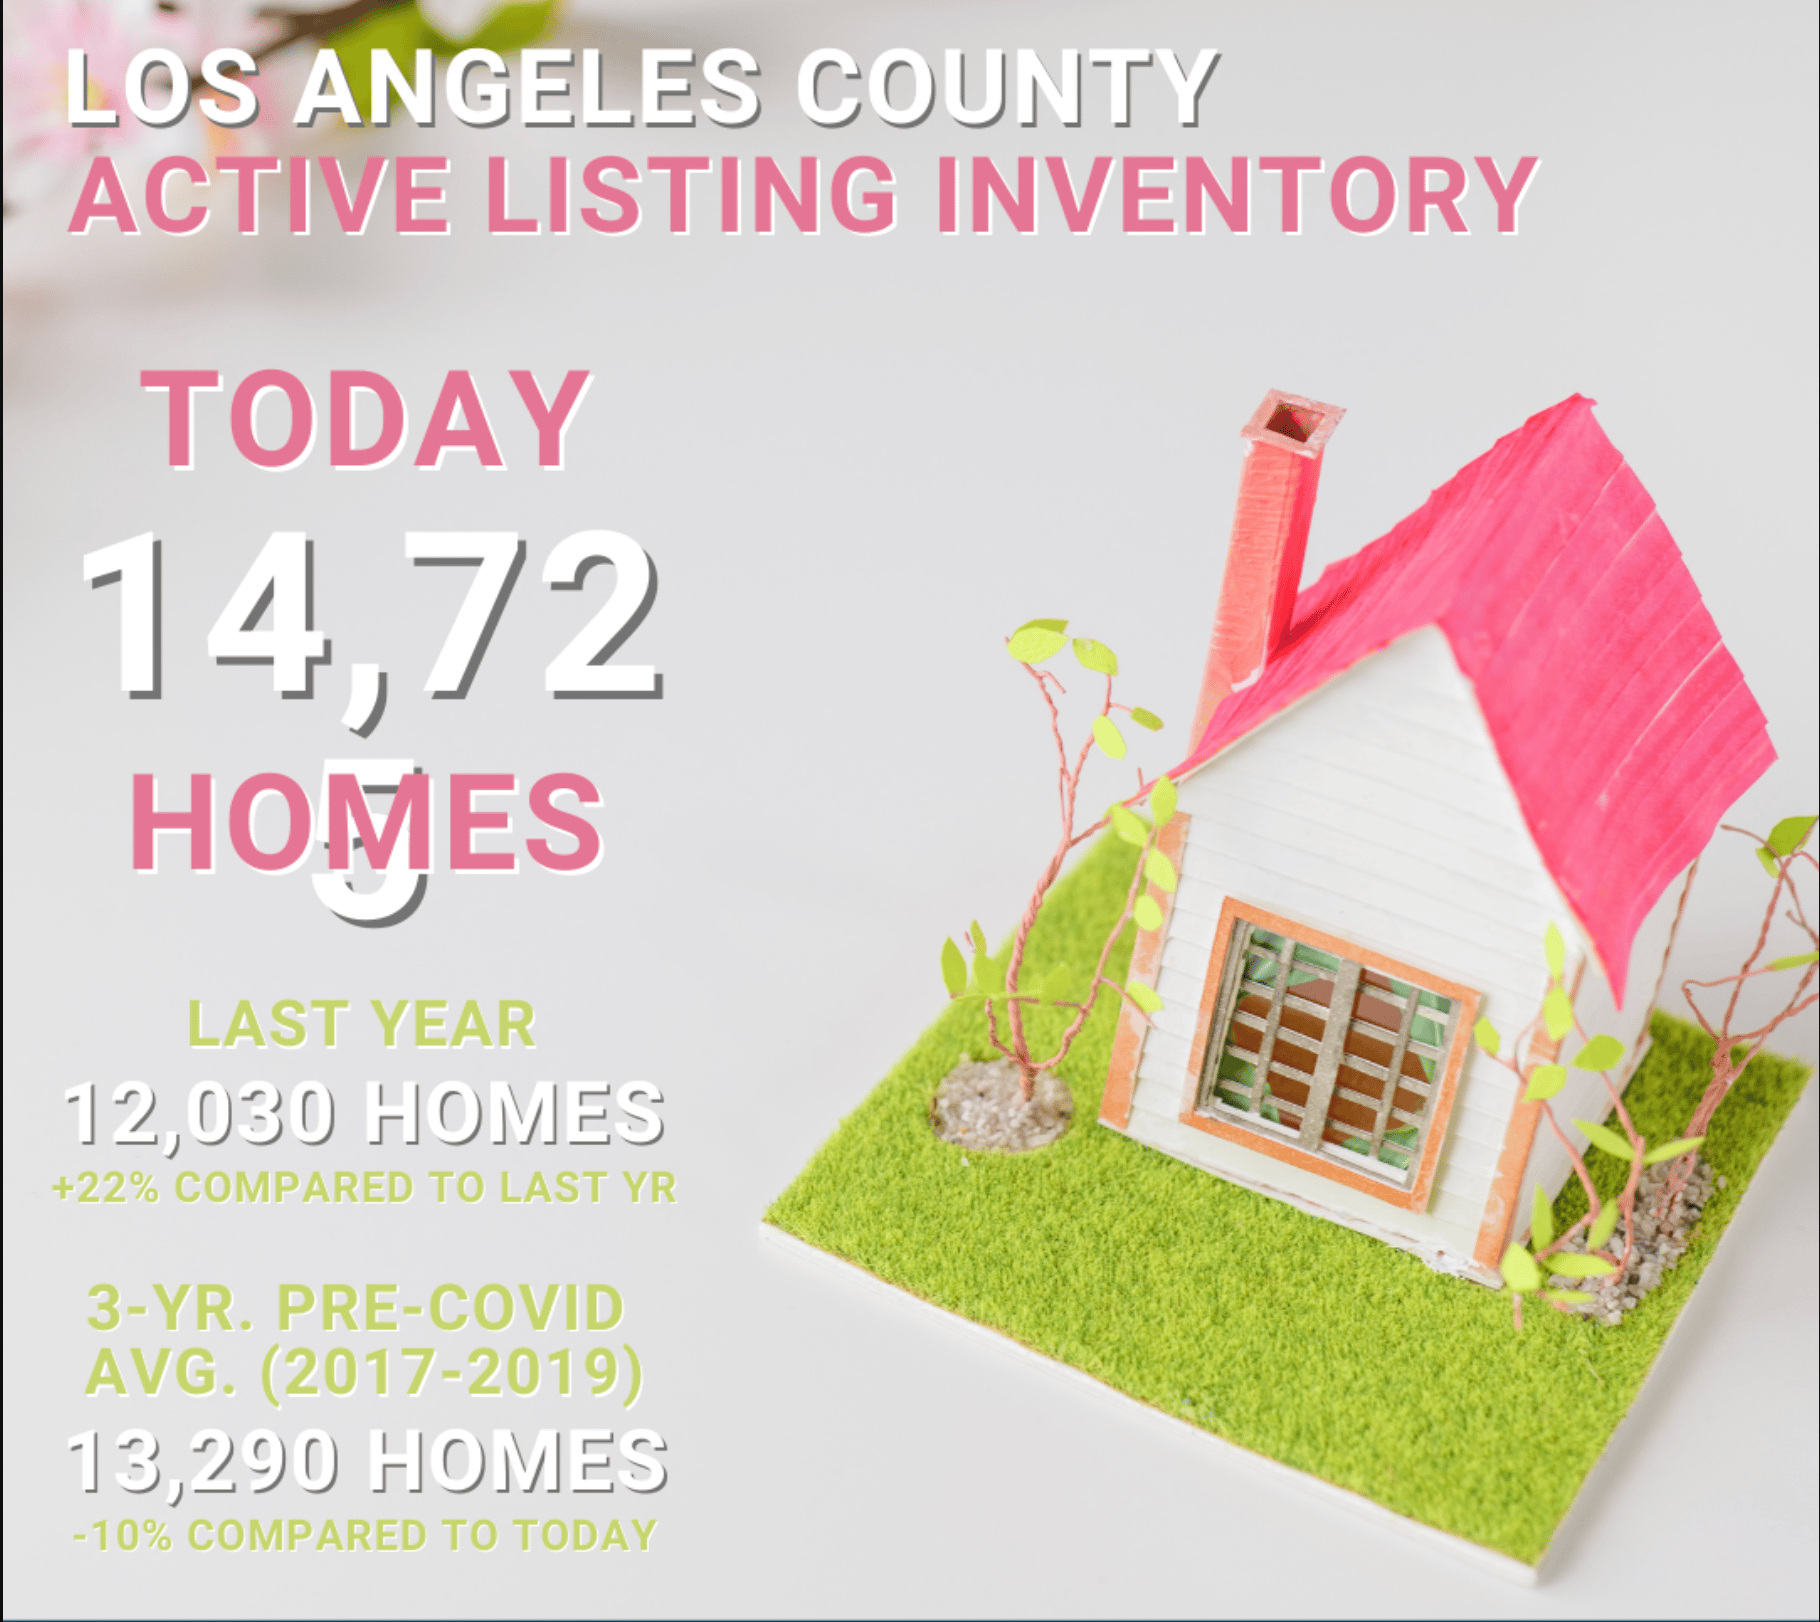
- INVENTORY: The active listing inventory over the past couple of weeks decreased by 160 homes, down 1%, and now stands at 14,725. Last year, there were 12,030 homes on the market, 2,695 fewer homes, or 18% less. The 3-year average before COVID (2017-2019) was 13,290, which is 10% lower. From January through August, 15% fewer homes came on the market compared to the 3-year average before COVID (2017-2019), 9,829 less. Yet, 6,362 more sellers came on the market this year than last, and 13,983 more compared to 2023.
- DEMAND: Buyer demand, the number of pending sales over the prior month, increased by 60 pending sales in the past two weeks, up 2%, and now totals 3,870. Last year, demand reached 3,708 pending sales, 4% less. The 3-year average before COVID (2017-2019) was 5,135, which is 33% higher.
- MARKET TIME: With supply falling and demand rising, the Expected Market Time, the number of days to sell all Los Angeles County listings at the current buying pace, decreased from 117 to 114 days in the past couple of weeks, its highest end-of-September level since tracking began in 2012. Last year, it was 97 days, slightly faster than today. The 3-year average before COVID (2017-2019) was 79 days, which is much quicker than today.
- LUXURY: In the past two weeks, the Expected Market Time for homes priced between $2 million and $3 million increased from 154 to 163 days. The Expected Market Time for homes priced between $3 million and $4 million decreased from 210 to 205 days. The Expected Market Time for homes priced between $4 million and $8 million decreased from 296 to 267 days. The Expected Market Time for homes priced above $8 million decreased from 1,003 to 783 days.
- DISTRESSED HOMES: Short sales and foreclosures combined, comprised only 0.7% of all listings and 0.6% of demand. There are 56 foreclosures and 51 short sales available today in Los Angeles County, totaling 107 distressed homes on the active market, a rise of nine from two weeks ago. Last year, 80 distressed homes were on the market, similar to today.
- CLOSED SALES: There were 3,930 closed residential resales in August, down 9% from August 2024’s 4,303 and down 9% from July 2025. The sales-to-list price ratio was 97.6% for Los Angeles County. Foreclosures accounted for 0.5% of all closed sales, and short sales accounted for 0.1%. That means that 99.4% of all sales were sellers with equity.
Curious what these trends mean for your neighborhood? Let’s connect!