No Flood of Foreclosures
Despite affordability challenges and a slowing job market, Orange County’s housing market remains stable and far from a foreclosure wave. Unlike the Great Recession, today’s homeowners benefit from stricter lending standards, stronger credit, and record equity. Distressed sales remain just a fraction of the market — any recent increases are simply a return toward pre-pandemic norms, not a sign of widespread trouble.
Inventory has posted its largest drop of the year, falling noticeably in the past couple of weeks, and will likely keep declining into the holiday season. Sellers remain hesitant to give up their low fixed-rate mortgages, though more homeowners have listed in 2025 than in the past two years.
Demand has inched higher, hitting its strongest level since spring as mortgage rates dipped below 6.5% for the first time in nearly a year. Still, activity remains below pre-COVID levels.
Market time shortened slightly but is still slower than last year, reflecting affordability constraints. The luxury segment has shown the most improvement, with stronger buyer demand and faster absorption, particularly at the higher end of the market.
Bottom line: Orange County’s housing market is adjusting, but resilient. Tight lending, healthy equity, and limited distressed sales continue to protect it from a foreclosure crisis.
Orange County Housing Summary
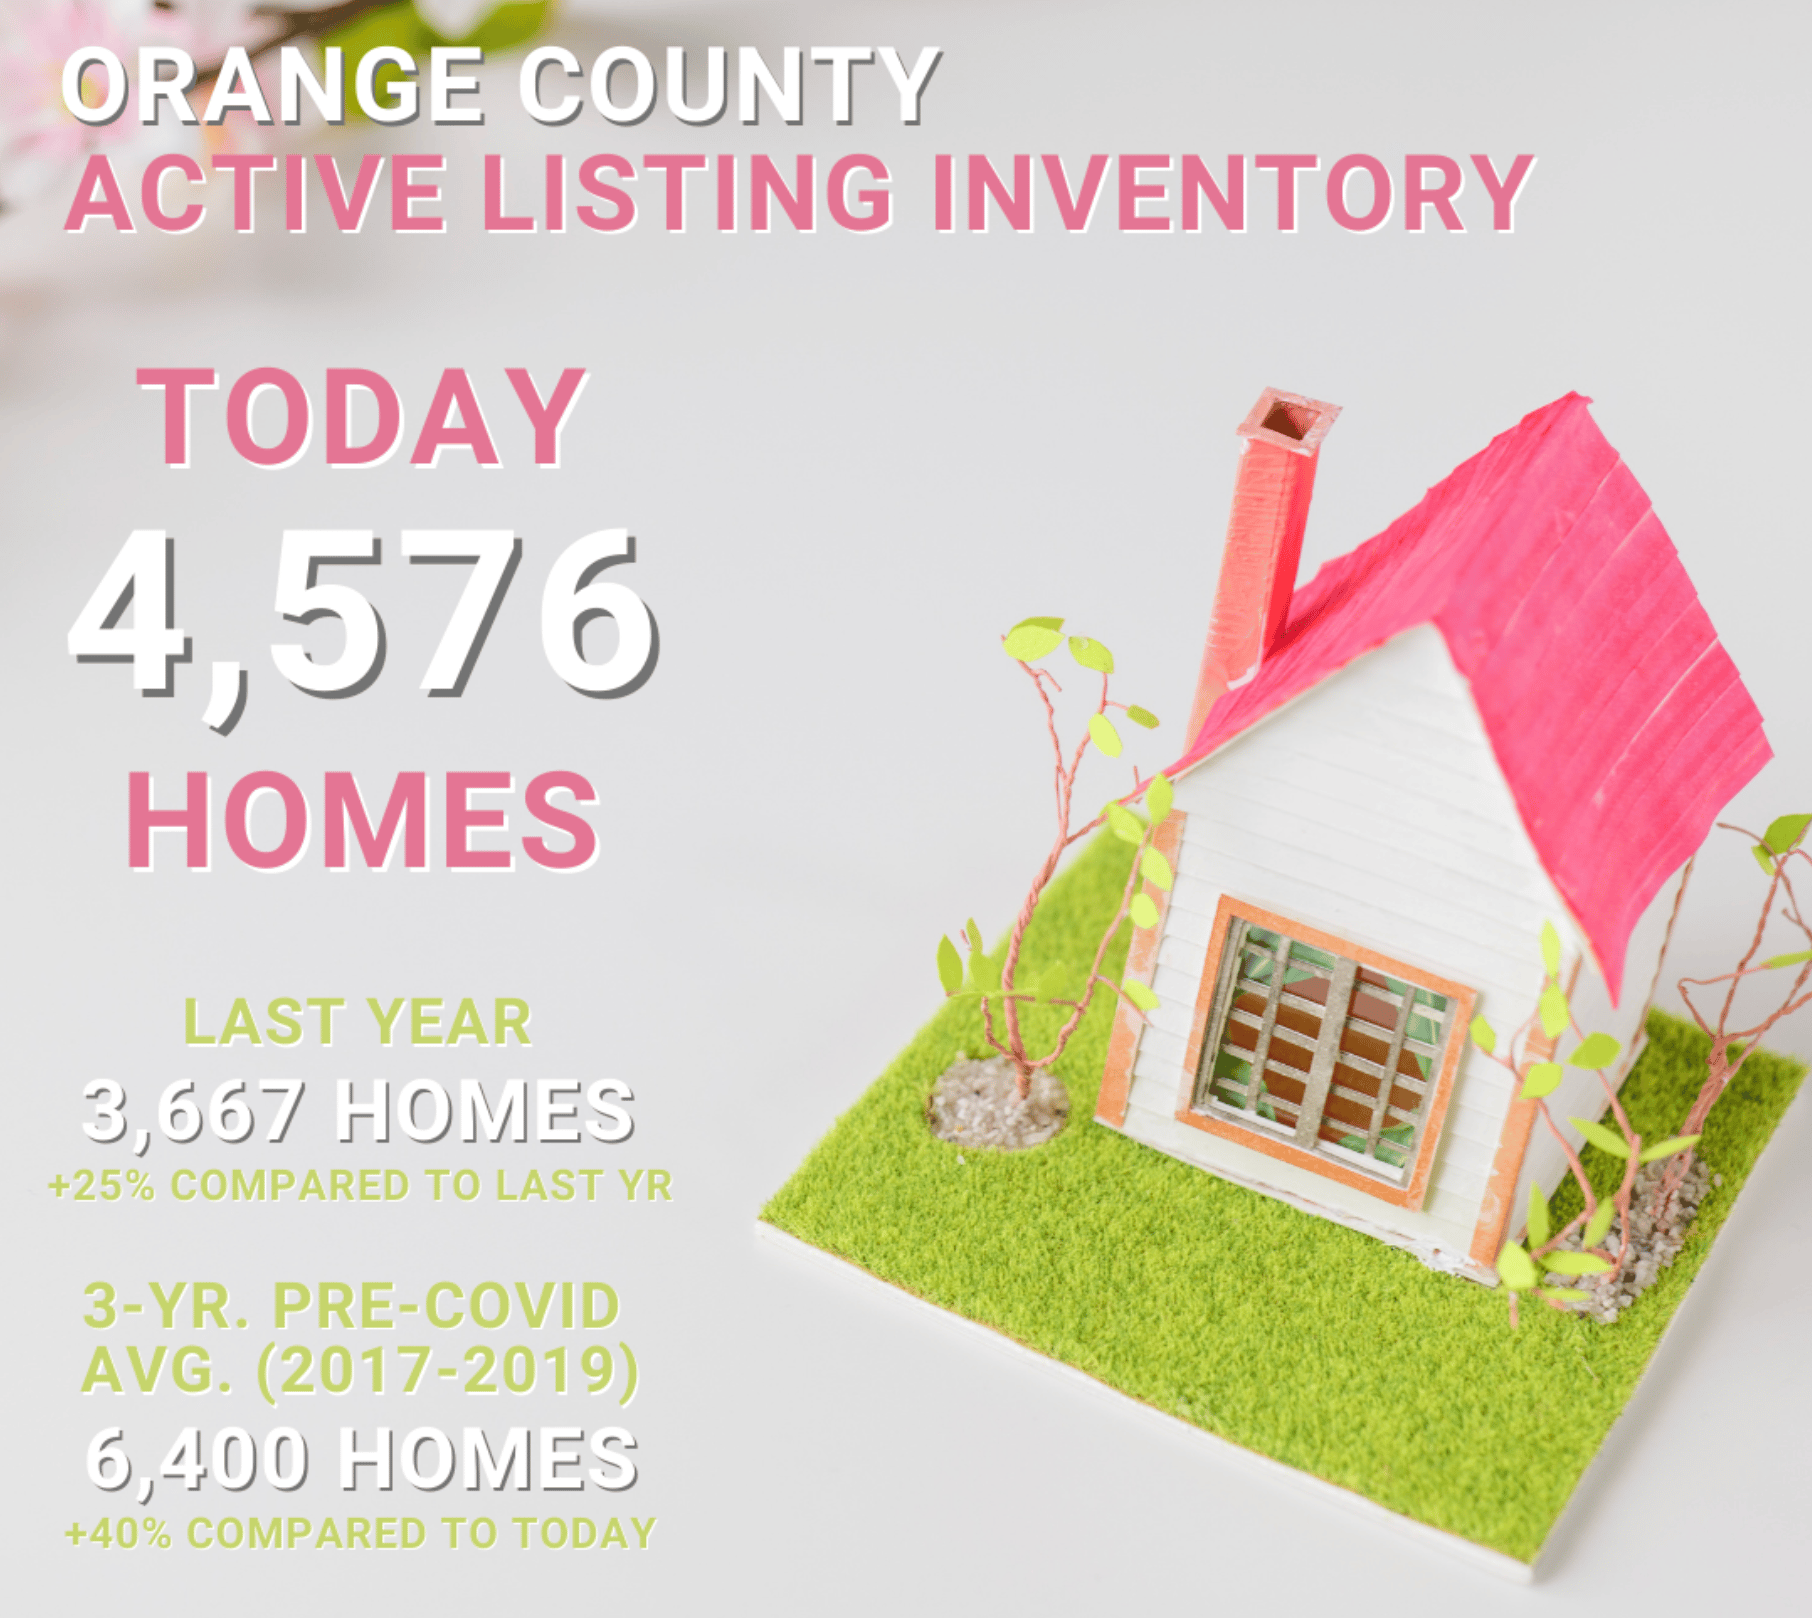
- INVENTORY: The active listing inventory in the past couple of weeks decreased by 182 homes, down 4%, and now stands at 4,576, its largest drop of the year. Last year, there were 3,666 homes on the market, 910 fewer homes, or 20% less. The 3-year average before COVID (2017-2019) was 6,400, which is 40% higher. From January through August, 26% fewer homes came on the market compared to the 3-year average before COVID (2017-2019), 7,561 less. Yet, 2,281 more sellers came on the market this year than last, and 5,053 more compared to 2023.
- DEMAND: Buyer demand, the number of pending sales over the prior month, increased by 18 homes, up 1%, and now stands at 1,609, its highest level since the end of March. Last year, there were 1,591 pending sales, 3% lower than today. The 3-year average before COVID (2017-2019) was 2,262, which is 41% higher.
- MARKET TIME: With inventory falling and demand rising, the Expected Market Time, the number of days to sell all Orange County listings at the current buying pace, decreased from 90 to 86 days in the past couple of weeks, its lowest level since June. Yet, it is still the highest end-of-September level since 2019. Last year, it was 71 days, slightly faster than today. The 3-year average before COVID (2017-2019) was 86 days, similar to today.
- LUXURY: In the past two weeks, the Expected Market Time for homes priced between $2.5 million and $4 million decreased from 163 to 148 days. For homes priced between $4 million and $6 million, the Expected Market Time decreased from 224 to 188 days. For homes priced above $6 million, the Expected Market Time decreased from 447 to 334 days.
- DISTRESSED HOMES: Short sales and foreclosures combined, comprised only 0.2% of all listings and 0.2% of demand. Only four foreclosures and four short sales are available today in Orange County, with a total of eight distressed homes on the active market, down one from two weeks ago. Last year, five distressed homes were on the market, similar to today.
- CLOSED SALES: There were 1,875 closed residential resales in August, nearly identical to August 2024’s 1,877 sales, and down 3% from July 2025. The sales-to-list price ratio was 98.5% for Orange County. Foreclosures accounted for 0.2% of all closed sales, and short sales accounted for 0.1%. That means that 99.7% of all sales were sellers with equity.
For hyperlocal market insights or to discuss what these trends mean for your neighborhood, let’s connect!