Values Rising
Despite the high mortgage rate environment eroding home affordability, home values in Orange County have been on the rise after bottoming in December.
---
Home Price Appreciation
The catastrophically low supply of available homes will continue to propel a rise in home values.
Plenty of housing naysayers have been calling for a severe market correction ever since home values skyrocketed higher after the initial COVID lockdowns from June 2020 through May 2022, two years of rapid appreciation. Then with mortgage rates climbing sharply from 3.25% in January of last year to 7.37% in October, the naysayers’ chorus grew much louder. Many anticipated a sharp decline in home values that rivaled the Great Recession. They can get quite emotional about their position. On the face of it, experiencing a swift rise in home values reminiscent of 2000 through 2005 and then the massive erosion in home affordability last year, it is understandable that some would conclude that prices would fall. And they did for seven months last year, but that all changed after they bottomed out in December.

Active Listings:
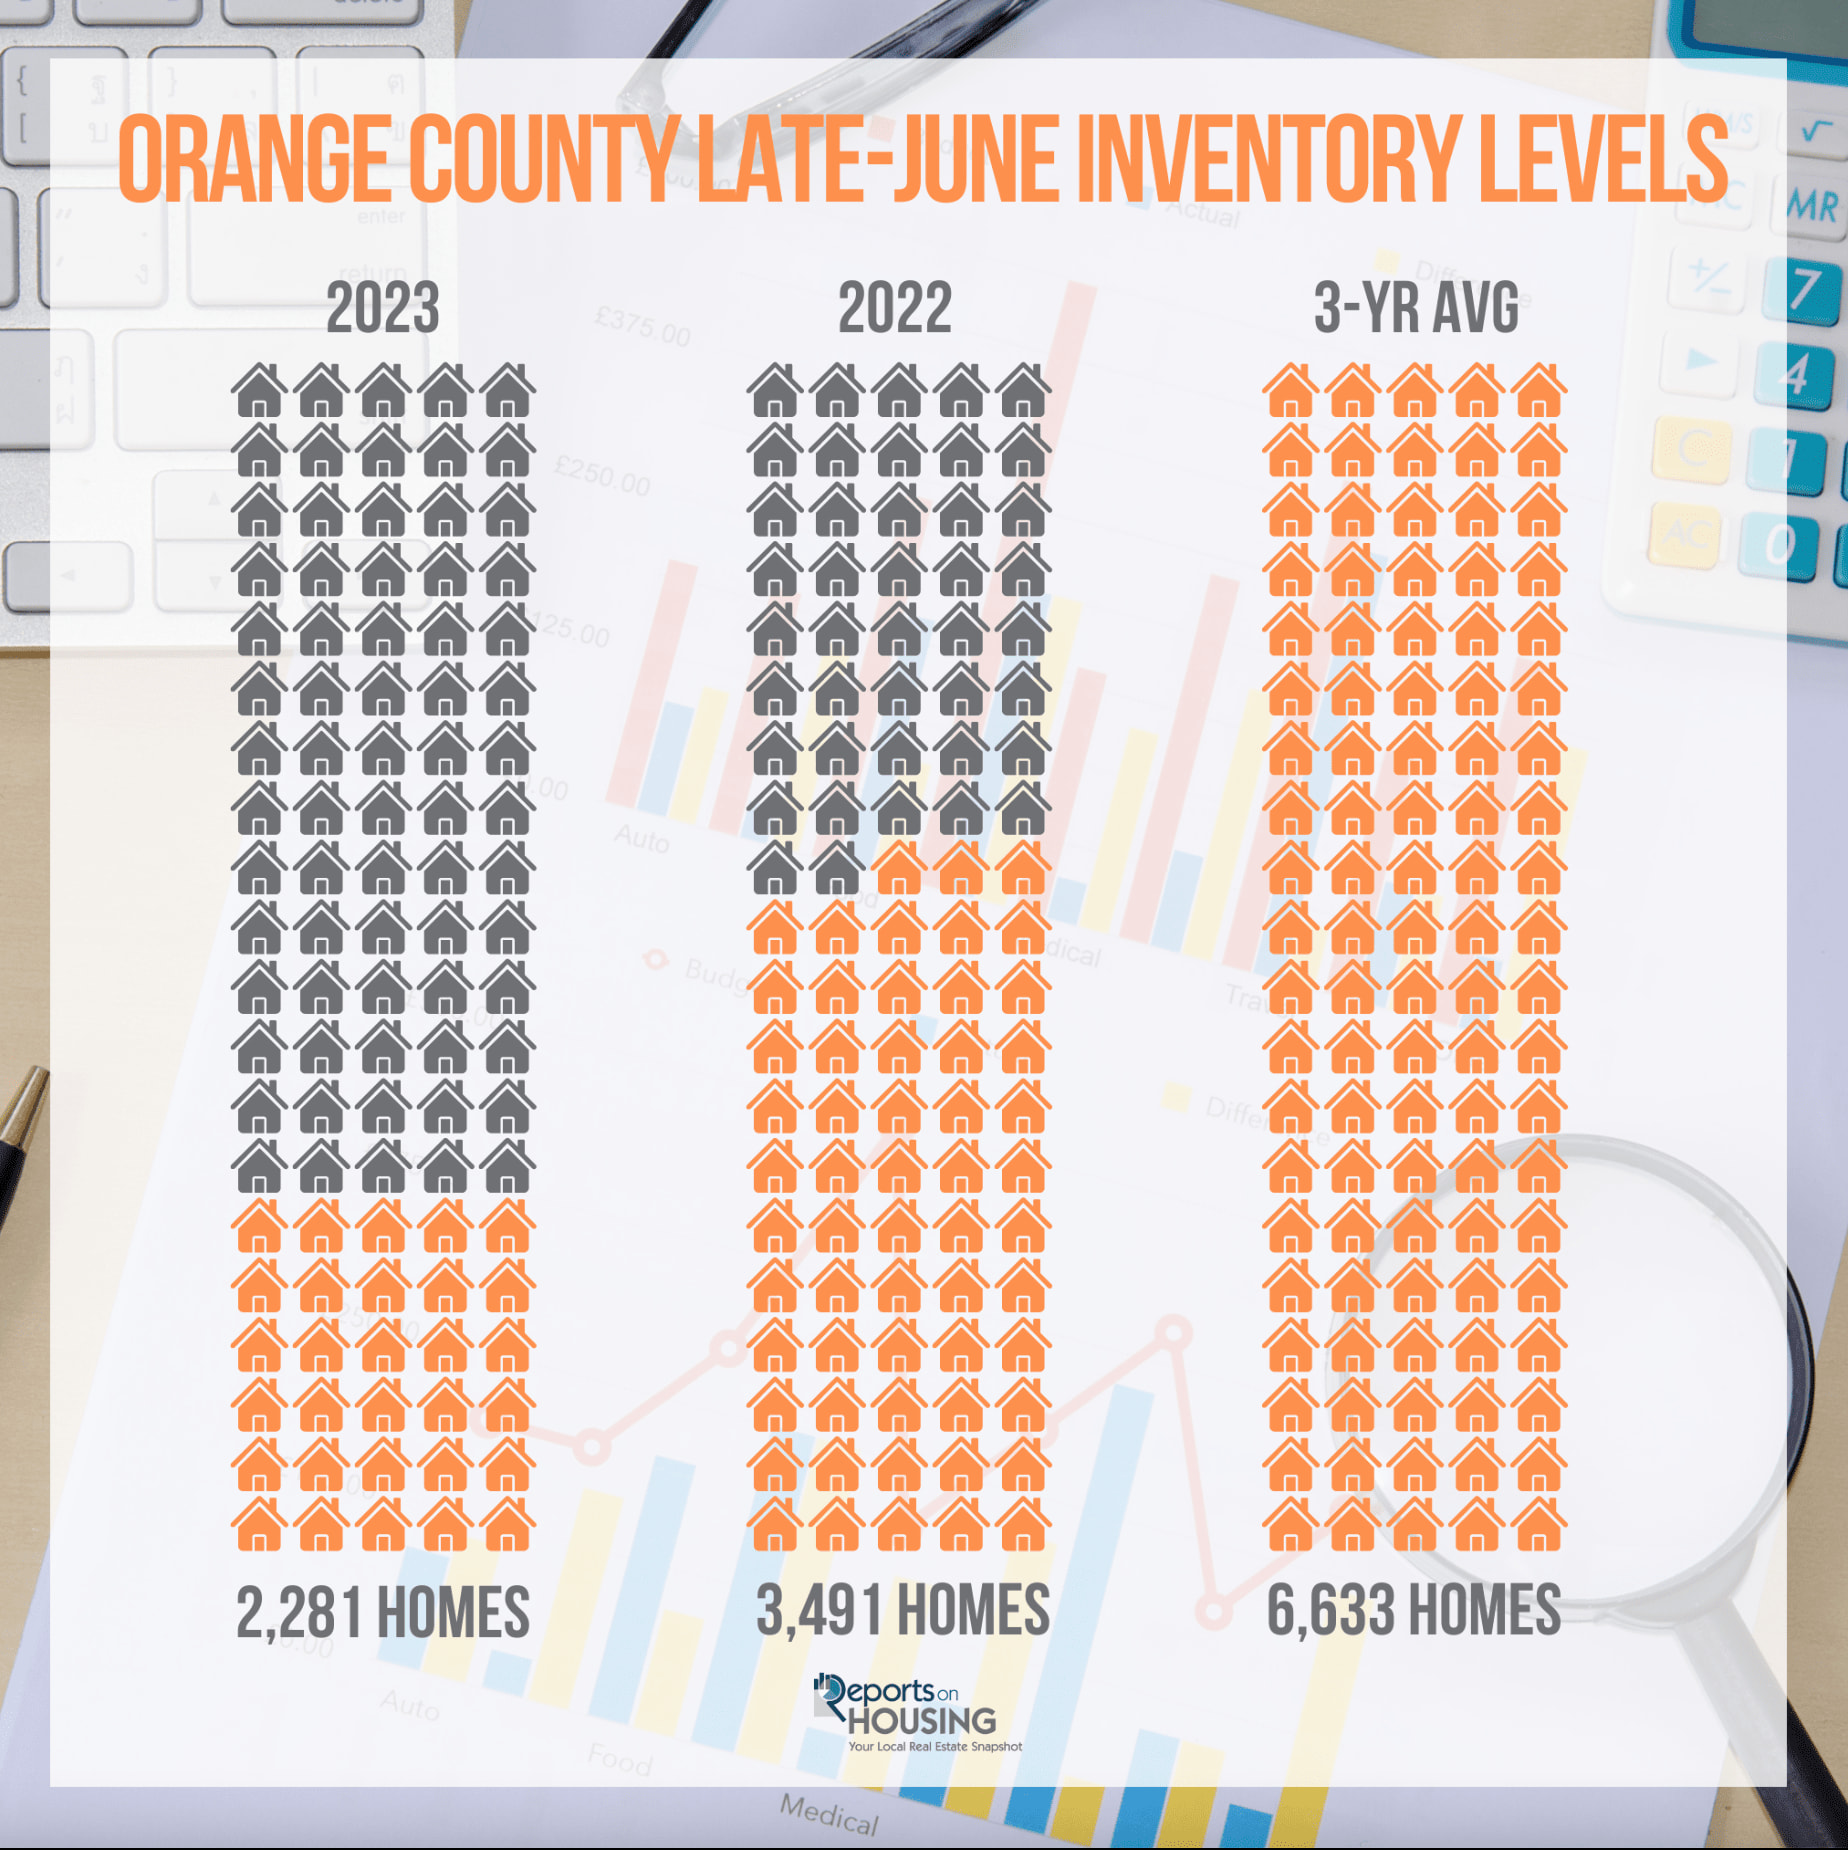
The active listing inventory in the past couple of weeks increased by 85 homes, up 4%, and now sits at 2,281. Regardless, it is the lowest level for an end to June since tracking began in 2004. In May, 45% fewer homes came on the market compared to the 3-year average before COVID (2017 to 2019), 1,879 less. Last year, there were 3,491 homes on the market, 1,210 more homes, or 53% higher. The 3-year average before COVID (2017 to 2019) was 6,633, or 191% more, nearly triple.
Demand:
Demand, the number of pending sales over the prior month, increased by 7 pending sales in the past two weeks, nearly unchanged, and now totals 1,602, the lowest level for an end to June since tracking began in 2004. Last year, there were 1,861 pending sales, 16% more than today. The 3-year average before COVID (2017 to 2019) was 2,679, or 67% more.
Orange County Housing Summary
- The active listing inventory in the past couple of weeks increased by 85 homes, up 4%, and now sits at 2,281. Regardless, it is the lowest level for an end to June since tracking began in 2004. In May, 45% fewer homes came on the market compared to the 3-year average before COVID (2017 to 2019), 1,879 less. Last year, there were 3,491 homes on the market, 1,210 more homes, or 53% higher. The 3-year average before COVID (2017 to 2019) was 6,633, or 191% more, nearly triple.
- Demand, the number of pending sales over the prior month, increased by 7 pending sales in the past two weeks, nearly unchanged, and now totals 1,602, the lowest level for an end to June since tracking began in 2004. Last year, there were 1,861 pending sales, 16% more than today. The 3-year average before COVID (2017 to 2019) was 2,679, or 67% more.
- With the supply rising, the Expected Market Time, the number of days to sell all Orange County listings at the current buying pace, increased from 41 to 43 days in the past couple of weeks. It was 56 days last year, slower than today and rapidly cooling as rates were rising.
- For homes priced below $750,000, the Expected Market Time increased from 28 to 29 days. This range represents 18% of the active inventory and 27% of demand.
- For homes priced between $750,000 and $1 million, the Expected Market Time increased from 27 to 28 days. This range represents 15% of the active inventory and 23% of demand.
- For homes priced between $1 million to $1.25 million, the Expected Market Time increased from 30 to 32 days. This range represents 11% of the active inventory and 14% of demand.
- For homes priced between $1.25 million to $1.5 million, the Expected Market Time decreased from 35 to 31 days. This range represents 10% of the active inventory and 13% of demand.
- For homes priced between $1.5 million to $2 million, the Expected Market Time increased from 50 to 51 days. This range represents 13% of the active inventory and 11% of demand.
- For homes priced between $2 million and $4 million, the Expected Market Time in the past two weeks increased from 76 to 89 days. For homes priced between $4 million and $6 million, the Expected Market Time decreased from 163 to 131 days. For homes priced above $6 million, the Expected Market Time increased from 274 to 435 days.
- The luxury end, all homes above $2 million, account for 34% of the inventory and 12% of demand.
- Distressed homes, both short sales and foreclosures combined, comprised only 0.3% of all listings and 0.1% of demand. Only two foreclosures and five short sales are available today in Orange County, with seven total distressed homes on the active market, down one from two weeks ago. Last year there were five distressed homes on the market, similar to today.
- There were 2,030 closed residential resales in May, 19% less than May 2022’s 2,520 closed sales. May marked a 20% rise compared to April 2023. The sales-to-list price ratio was 102.6% for all of Orange County. Foreclosures accounted for 0.25% of all closed sales, and short sales accounted for 0.05%. That means that 99.7% of all sales were good ol’ fashioned sellers with equity.