Los Angeles County Housing Report:
Still Waiting, No Offers
Although many sellers approach the housing market as if it is as hot as 2023 or early spring of this year, they quickly realize that it is not instant.
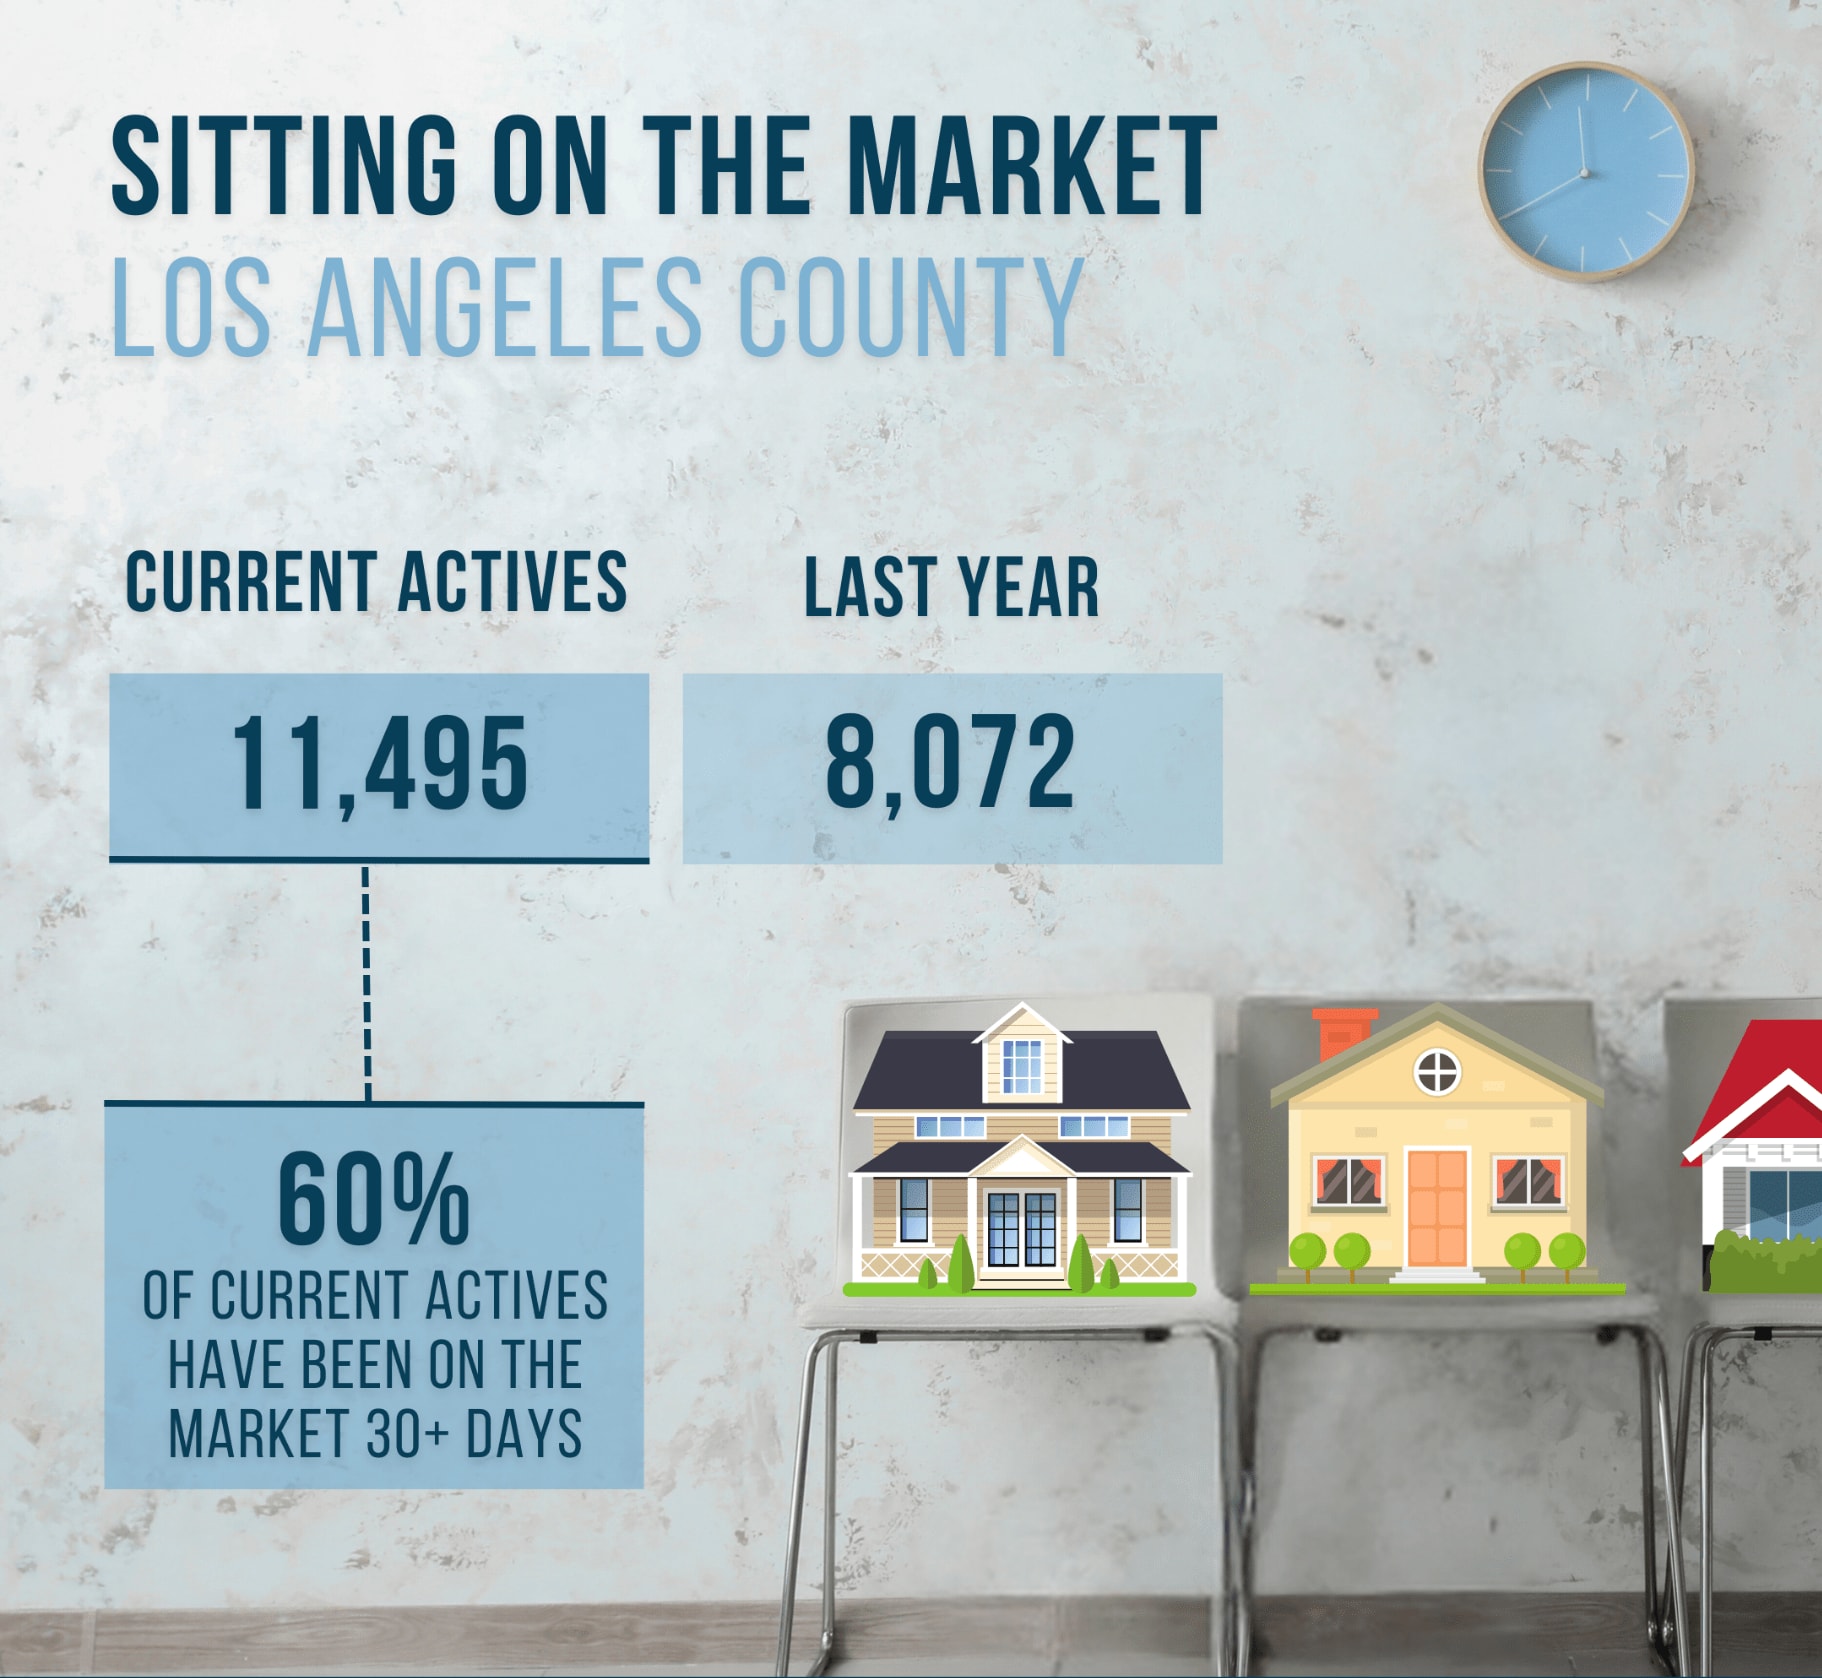
The Los Angeles housing market has undergone a significant shift from the sizzling activity of early 2024. While many sellers may have anticipated a repeat of the swift sales and multiple offers from earlier in the year, the current landscape reveals a more tempered market. Presently, about 60% of active listings have been on the market for at least 30 days, with a notable portion—37%—remaining unsold for over two months. This slowdown is evident across various price ranges, with even homes below $750,000 experiencing extended waiting periods. The transition from a hot Seller's Market to a more Balanced Market has made price adjustments crucial for securing offers.
This change in market dynamics can be attributed to an increase in the number of homes for sale. Active inventory has surged by 48% since March, rising from 7,748 to 11,495 listings. Despite a 10% increase in demand year over year, the influx of new listings has contributed to the extended Expected Market Time, which has grown from 60 days in March to 88 days currently. Sellers are finding that achieving a successful sale now requires a keen understanding of current market conditions and a strategic approach to pricing.
Active Listings
The active listing inventory in the past couple of weeks increased by 221 homes, up 2%, and now sits at 11,495 homes. In July, 19% fewer homes came on the market compared to the 3-year average before COVID (2017 to 2019), 1,680 less. Yet, 1,274 more sellers came on the market this year compared to July 2023. Last year, there were 8,072 homes on the market, 3,423 fewer homes, or 30% less. The 3-year average before COVID (2017 to 2019) was 13,288, or 16% more.
Demand
Demand, the number of pending sales over the prior month, increased by 350 pending sales in the past two weeks, up 3%, and now totals 3,906. Last year, there were 3,556 pending sales, 9% fewer. The 3-year average before COVID (2017 to 2019) was 5,646, or 45% more.
Los Angeles County Housing Summary
- With demand rising faster than supply, the Expected Market Time, the number of days to sell all Los Angeles County listings at the current buying pace, decreased from 89 to 88 days in the past couple of weeks. It was 68 days last year, hotter than today. The 3-year average before COVID (2017 to 2019) was 71 days, also faster than today.
- In the past couple of weeks, the Expected Market Time for homes priced below $750,000 remained unchanged at 63 days. This range represents 27% of the active inventory and 37% of demand.
- The Expected Market Time for homes priced between $750,000 and $1 million decreased from 64 to 63 days. This range represents 19% of the active inventory and 27% of demand.
- The Expected Market Time for homes priced between $1 million and $1.5 million increased from 81 to 85 days. This range represents 18% of the active inventory and 19% of demand.
- The Expected Market Time for homes priced between $1.5 million and $2 million decreased from 119 to 115 days. This range represents 10% of the active inventory and 8% of demand.
- In the past two weeks, the Expected Market Time for homes priced between $2 million and $3 million increased from 154 to 162 days. The Expected Market Time for homes priced between $3 million and $4 million decreased from 243 to 237 days. The Expected Market Time for homes priced between $4 million and $8 million decreased from 427 to 373 days. The Expected Market Time for homes priced above $8 million decreased from 1,320 to 713 days.
- The luxury end, all homes above $2 million, account for 26% of the inventory and 9% of demand.
- Distressed homes, both short sales and foreclosures combined, made up only 0.7% of all listings and 0.8% of demand. Only 52 foreclosures and 24 short sales are available to purchase today in all of Los Angeles County, with 76 total distressed homes on the active market, up ten from two weeks ago. Last year, there were 50 total distressed homes on the market, slightly fewer than today.
- There were 4,032 closed residential resales in July, up 14% compared to July 2023’s 3,804 closed sales, and up 7% from June 2024. The sales-to-list price ratio was 99.8% for all of Los Angeles County. Foreclosures accounted for just 0.2% of all closed sales, and short sales accounted for 0.1%. That means that 99.7% of all sales were good ol’ fashioned sellers with equity.
Don't hesitate to reach out if you have any questions.