A Jump in Demand
After topping 7.5% in April, mortgage rates have declined to the low sixes and have remained there with duration, paving the way for an uncharacteristic late September rise in demand.
Lower Rates Impact Demand
The Los Angeles County housing market is seeing an unexpected rise in demand as mortgage rates decline to the low sixes, following months of rates above 7.5%. In the past couple of weeks, buyer demand increased by 3%, with pending home sales rising from 3,585 to 3,708. This surge is the largest late-September increase in demand since 2014, reversing the typical seasonal trend where demand usually drops at this time of year. With affordability improving—monthly payments on a $1 million home have decreased by $749 compared to last year—buyers are returning to the market, driving the market time down from 100 to 97 days.
This jump in demand, combined with a slight 1% rise in inventory, signals an unusual uptick in the typically slower Autumn Market. As mortgage rates hold steady in the low sixes, demand is expected to continue rising, particularly if rates fall into the fives for the first time since August 2022. The market's response to lower rates is offering a "green shoot" for recovery, with closed sales also expected to increase as affordability improves further and economic conditions support ongoing housing activity.
Active Listings
The active listing inventory in the past couple of weeks increased by 133 homes, up 1%, and now sits at 12,030 homes, its first time above 12,000 since November 2019. In August, 24% fewer homes came on the market compared to the 3-year average before COVID (2017 to 2019), 2,017 less. Yet, 793 more sellers came on the market this year compared to August 2023. Last year, there were 8,367 homes on the market, 3,663 fewer homes, or 30% less. The 3-year average before COVID (2017 to 2019) was 13,290, or 10% more.
Demand
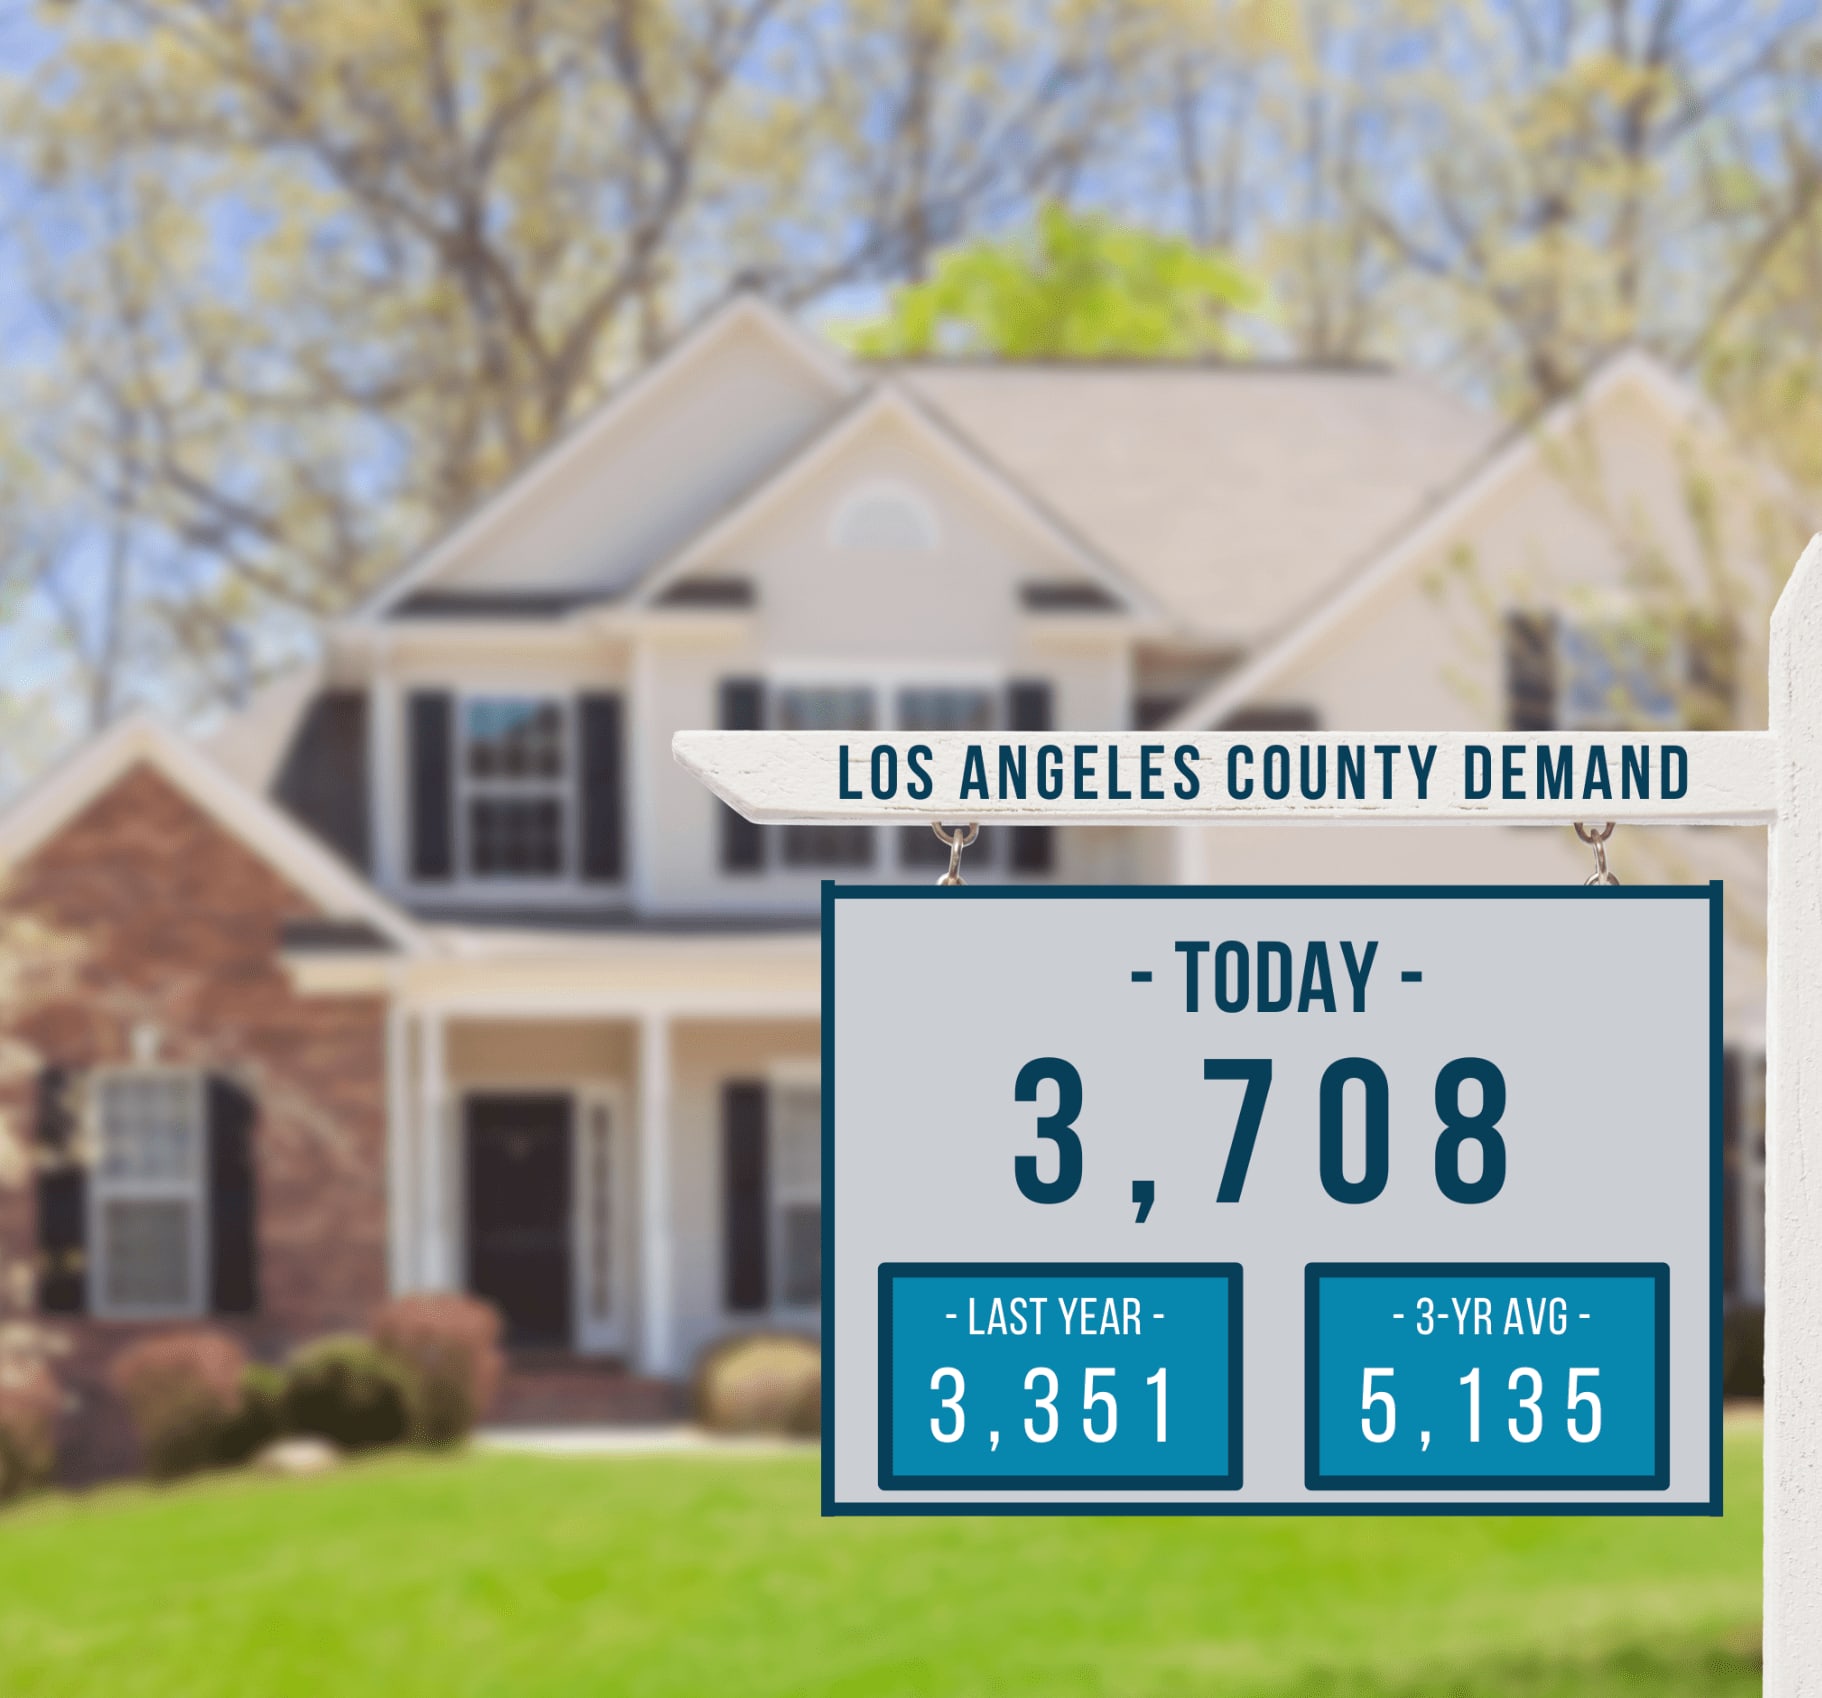
Demand, the number of pending sales over the prior month, jumped by 123 pending sales in the past two weeks, up 3%, and now totals 3,708, its largest rise since the beginning of May, during the Spring Market. Last year, there were 3,351 pending sales, 10% fewer. The 3-year average before COVID (2017 to 2019) was 5,135, or 38% more.
Los Angeles County Housing Summary
- With supply rising slightly and demand surging higher, the Expected Market Time, the number of days to sell all Los Angeles County listings at the current buying pace, decreased from 100 to 97 days in the past couple of weeks. It was 75 days last year, faster than today. The 3-year average before COVID (2017 to 2019) was 79 days, also faster than today.
- In the past couple of weeks, the Expected Market Time for homes priced below $750,000 increased from 71 to 72 days. This range represents 27% of the active inventory and 36% of demand.
- The Expected Market Time for homes priced between $750,000 and $1 million decreased from 77 to 73 days. This range represents 20% of the active inventory and 26% of demand.
- The Expected Market Time for homes priced between $1 million and $1.5 million decreased from 90 to 89 days. This range represents 18% of the active inventory and 19% of demand.
- The Expected Market Time for homes priced between $1.5 million and $2 million decreased from 152 to 132 days. This range represents 10% of the active inventory and 8% of demand.
- In the past two weeks, the Expected Market Time for homes priced between $2 million and $3 million increased from 160 to 161 days. The Expected Market Time for homes priced between $3 million and $4 million decreased from 221 to 208 days. The Expected Market Time for homes priced between $4 million and $8 million decreased from 320 to 303 days. The Expected Market Time for homes priced above $8 million increased from 606 to 923 days.
- The luxury end, all homes above $2 million, account for 25% of the inventory and 11% of demand.
- Distressed homes, both short sales and foreclosures combined, made up only 0.7% of all listings and 0.9% of demand. Only 54 foreclosures and 26 short sales are available to purchase today in all of Los Angeles County, with 80 total distressed homes on the active market, down three from two weeks ago. Last year, there were 48 total distressed homes on the market, slightly fewer than today.
- There were 4,303 closed residential resales in August, down 1% compared to August 2023’s 4,331 closed sales, and up 7% from July 2024. The sales-to-list price ratio was 99.5% for all of Los Angeles County. Foreclosures accounted for just 0.2% of all closed sales, and short sales accounted for 0.2%. That means that 99.6% of all sales were good ol’ fashioned sellers with equity.
Contact me for more information about the market and the strategies we use.