Hype Versus Data
From YouTube to TikTok to the backyard barbecue, there are plenty of narratives regarding the pending doom for housing that the underlying data does not support.
Stick to the Facts
The best advice in hearing all the talk swirling around the belief that a real estate crash lurks around the corner is to ignore the noise and stick to the facts.
Many YouTube channels, TikTok, and Instagram accounts are devoted to the housing crash narrative. Either housing is about to or is crashing. They are convinced that the market will implode and values will plunge similar to or worse than the Great Recession. The videos are persuasive in tone but lack the complete picture, ignoring the actual underlying facts. Many of these prognosticators lack the economic credentials and have been calling for a housing collapse for years, steering hundreds of thousands of unsuspecting viewers in the wrong direction, preying on everyone who has been unable to purchase over the years and has been rooting for housing’s demise so that they can finally capture a piece of the American Dream.
Home values rocketed higher from May 2020, right after the initial COVID lockdown, through May 2022. Rates plunged, reaching 17 record lows from March 2020 through January 2021, and remained low through March of last year. As rates climbed, the housing market slowed. After starting 2022 at 3.25%, they eclipsed 5% in May, 6% in September, and 7% in October. In the second half of the year, the housing crash crowd grew louder and louder as affordability eroded and home values declined. Is a housing downturn around the corner? Will home values plunge? The answer is straightforward in looking at the facts, not anytime soon. Ignore all the hype and rely on data.
Active listing
The active listing inventory in the past couple of weeks increased by 118 homes, up 2%, and now sits at 6,947 homes. In April, 43% fewer homes came on the market compared to the 3-year average before COVID (2017 to 2019), 3,856 less. Last year, there were 7,133 homes on the market, 186 extra homes, or 3% more. The 3-year average before COVID (2017 to 2019) was 12,088, or 74% more.
Demand
Demand, the number of pending sales over the prior month, increased by 35 pending sales in the past two weeks, up 1%, and now totals 4,050. Last year, there were 5,212 pending sales, 29% more than today. The 3-year average before COVID (2017 to 2019) was 5,978, or 48% more.
Los Angeles County Housing Summary
- The active listing inventory in the past couple of weeks increased by 118 homes, up 2%, and now sits at 6,947 homes. In April, 43% fewer homes came on the market compared to the 3-year average before COVID (2017 to 2019), 3,856 less. Last year, there were 7,133 homes on the market, 186 extra homes, or 3% more. The 3-year average before COVID (2017 to 2019) was 12,088, or 74% more.
- Demand, the number of pending sales over the prior month, increased by 35 pending sales in the past two weeks, up 1%, and now totals 4,050. Last year, there were 5,212 pending sales, 29% more than today. The 3-year average before COVID (2017 to 2019) was 5,978, or 48% more.
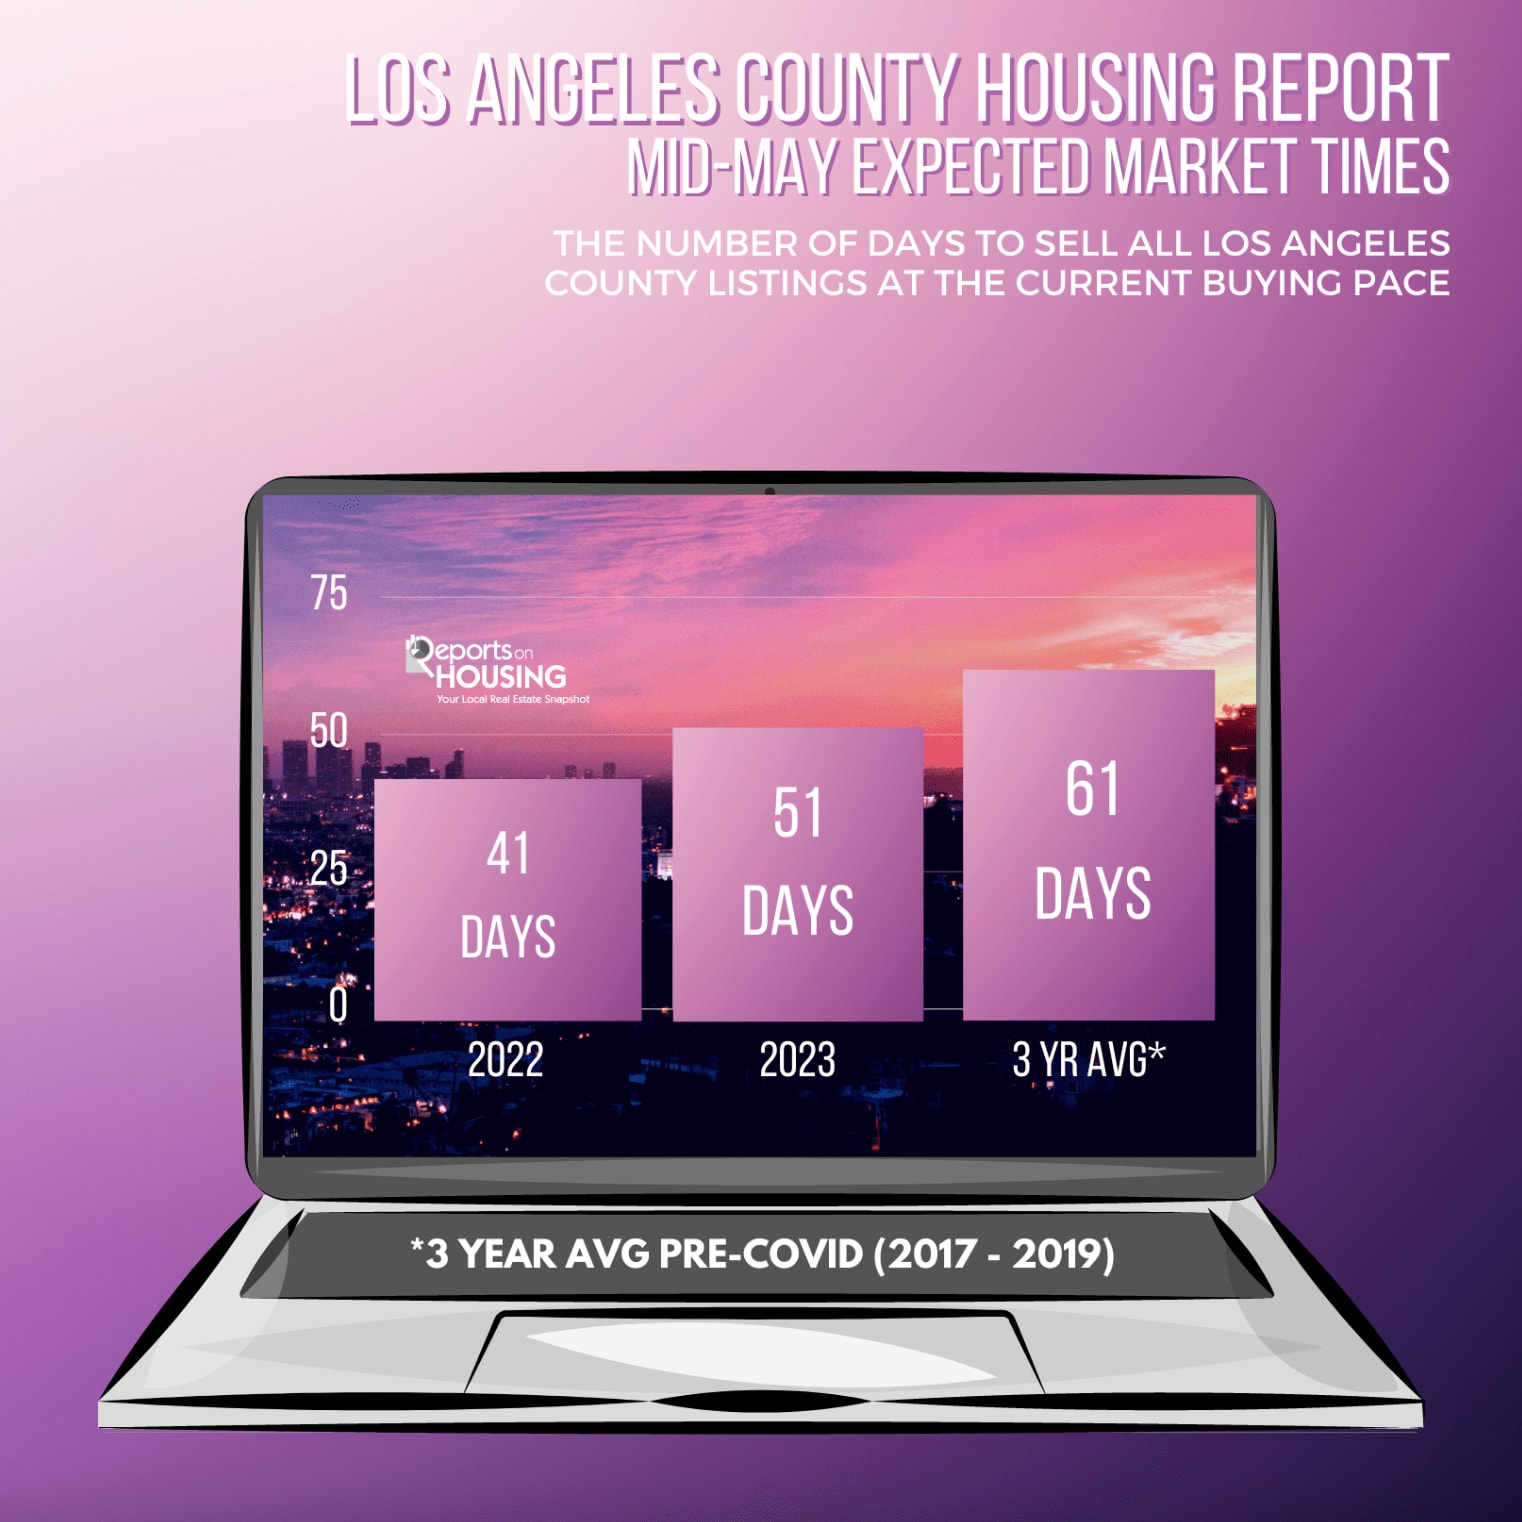
- With both supply and demand rising at similar rates, the Expected Market Time, the number of days to sell all Los Angeles County listings at the current buying pace, remained unchanged at 51 days in the past couple of weeks. It was 41 days last year, faster than today.
- For homes priced below $750,000, the Expected Market Time increased from 33 to 34 days in the past couple of weeks. This range represents 28% of the active inventory and 43% of demand.
- For homes priced between $750,000 and $1 million, the Expected Market Time decreased from 38 to 37 days. This range represents 17% of the active inventory and 24% of demand.
- For homes priced between $1 million to $1.5 million, the Expected Market Time increased from 49 to 52 days. This range represents 16% of the active inventory and 16% of demand.
- For homes priced between $1.5 million to $2 million, the Expected Market Time decreased from 66 to 65 days. This range represents 10% of the active inventory and 8% of demand.
- For homes priced between $2 million and $3 million, the Expected Market Time in the past couple of weeks increased from 89 to 92 days. For homes priced between $3 million and $4 million, the Expected Market Time decreased from 174 to 146 days. For homes priced between $4 million and $8 million, the Expected Market Time decreased from 231 to 205 days. For homes priced above $8 million, the Expected Market Time decreased from 1,380 to 684 days.
- The luxury end, all homes above $2 million, account for 31% of the inventory and 10% of demand.
- Distressed homes, both short sales and foreclosures combined, made up only 0.6% of all listings and 1% of demand. Only 27 foreclosures and 15 short sales are available to purchase today in all of Los Angeles County, 42 total distressed homes on the active market, down nine in the past two weeks. Last year there were 26 total distressed homes on the market, slightly fewer than today.
- There were 3,642 closed residential resales in April, 38% less than April 2022’s 5,882 closed sales. April marked a 13% drop compared to March 2023. The sales-to-list price ratio was 101.6% for all of Los Angeles County. Foreclosures accounted for just 0.5% of all closed sales, and short sales accounted for 0.2%. That means that 99.3% of all sales were good ol’ fashioned sellers with equity.