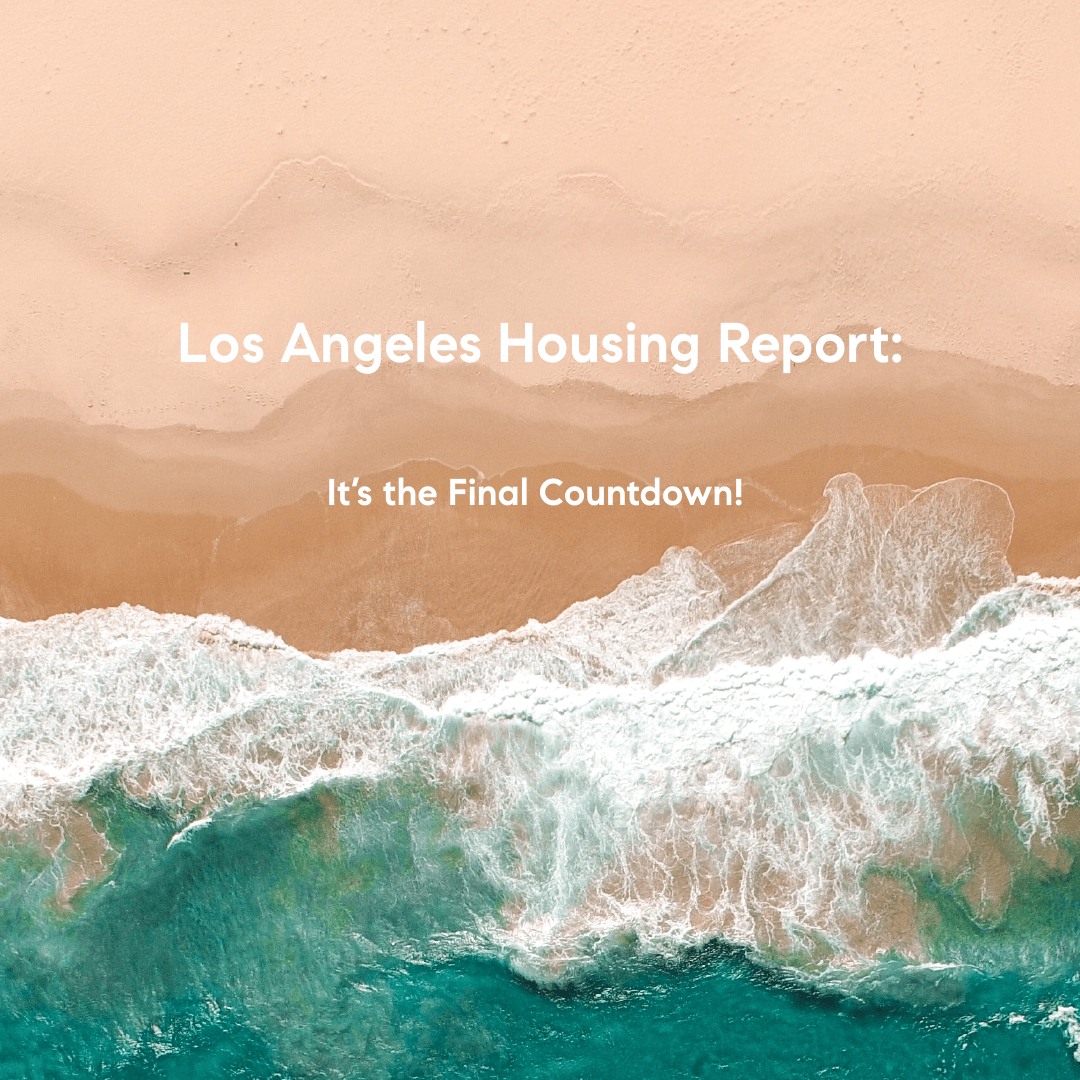
It’s the Final Countdown!
The window of opportunity to take advantage of the Summer Market, the second best time of the year for selling, will soon be coming to a close.
Running Out of Time
Demand will remain elevated for the next month, but from there, it will decelerate for the remainder of the year.
The Women’s World Cup has started, and millions of soccer enthusiasts will be tuned in worldwide for the next month. There will undoubtedly be blowouts. But there will also be close games where fans will be on the edge of their seats anxiously watching the last seconds of the game tic down to zero. Similarly, the Los Angeles County Summer Market is rapidly coming to a close. By the end of August, just a month from now, housing will transition to the Autumn Market.
Spring is the best time to sell a home, from mid-March through the end of May when the kids get out of school. Demand peaks, and typically, inventory rises. The second best time of the year to sell is the Summer Market, from June through the end of August, when the kids go back to school. Buyers and sellers transact year-round, but families prefer to find a home during the spring or summer and close before the school year starts. Back to school means fewer buyers are yearning to make an immediate move. Buyers with children factor in the inconvenience and strain on their family in moving while the kids are in school. As a result, many buyers wait until the following spring to start the process all over again in isolating a home for their family.
Demand
Demand, the number of pending sales over the prior month, decreased by 16 pending sales in the past two weeks, nearly unchanged, and now totals 3,718. Last year, there were 4,121 pending sales, 11% more than today. The 3-year average before COVID (2017 to 2019) was 5,543, or 49% more.
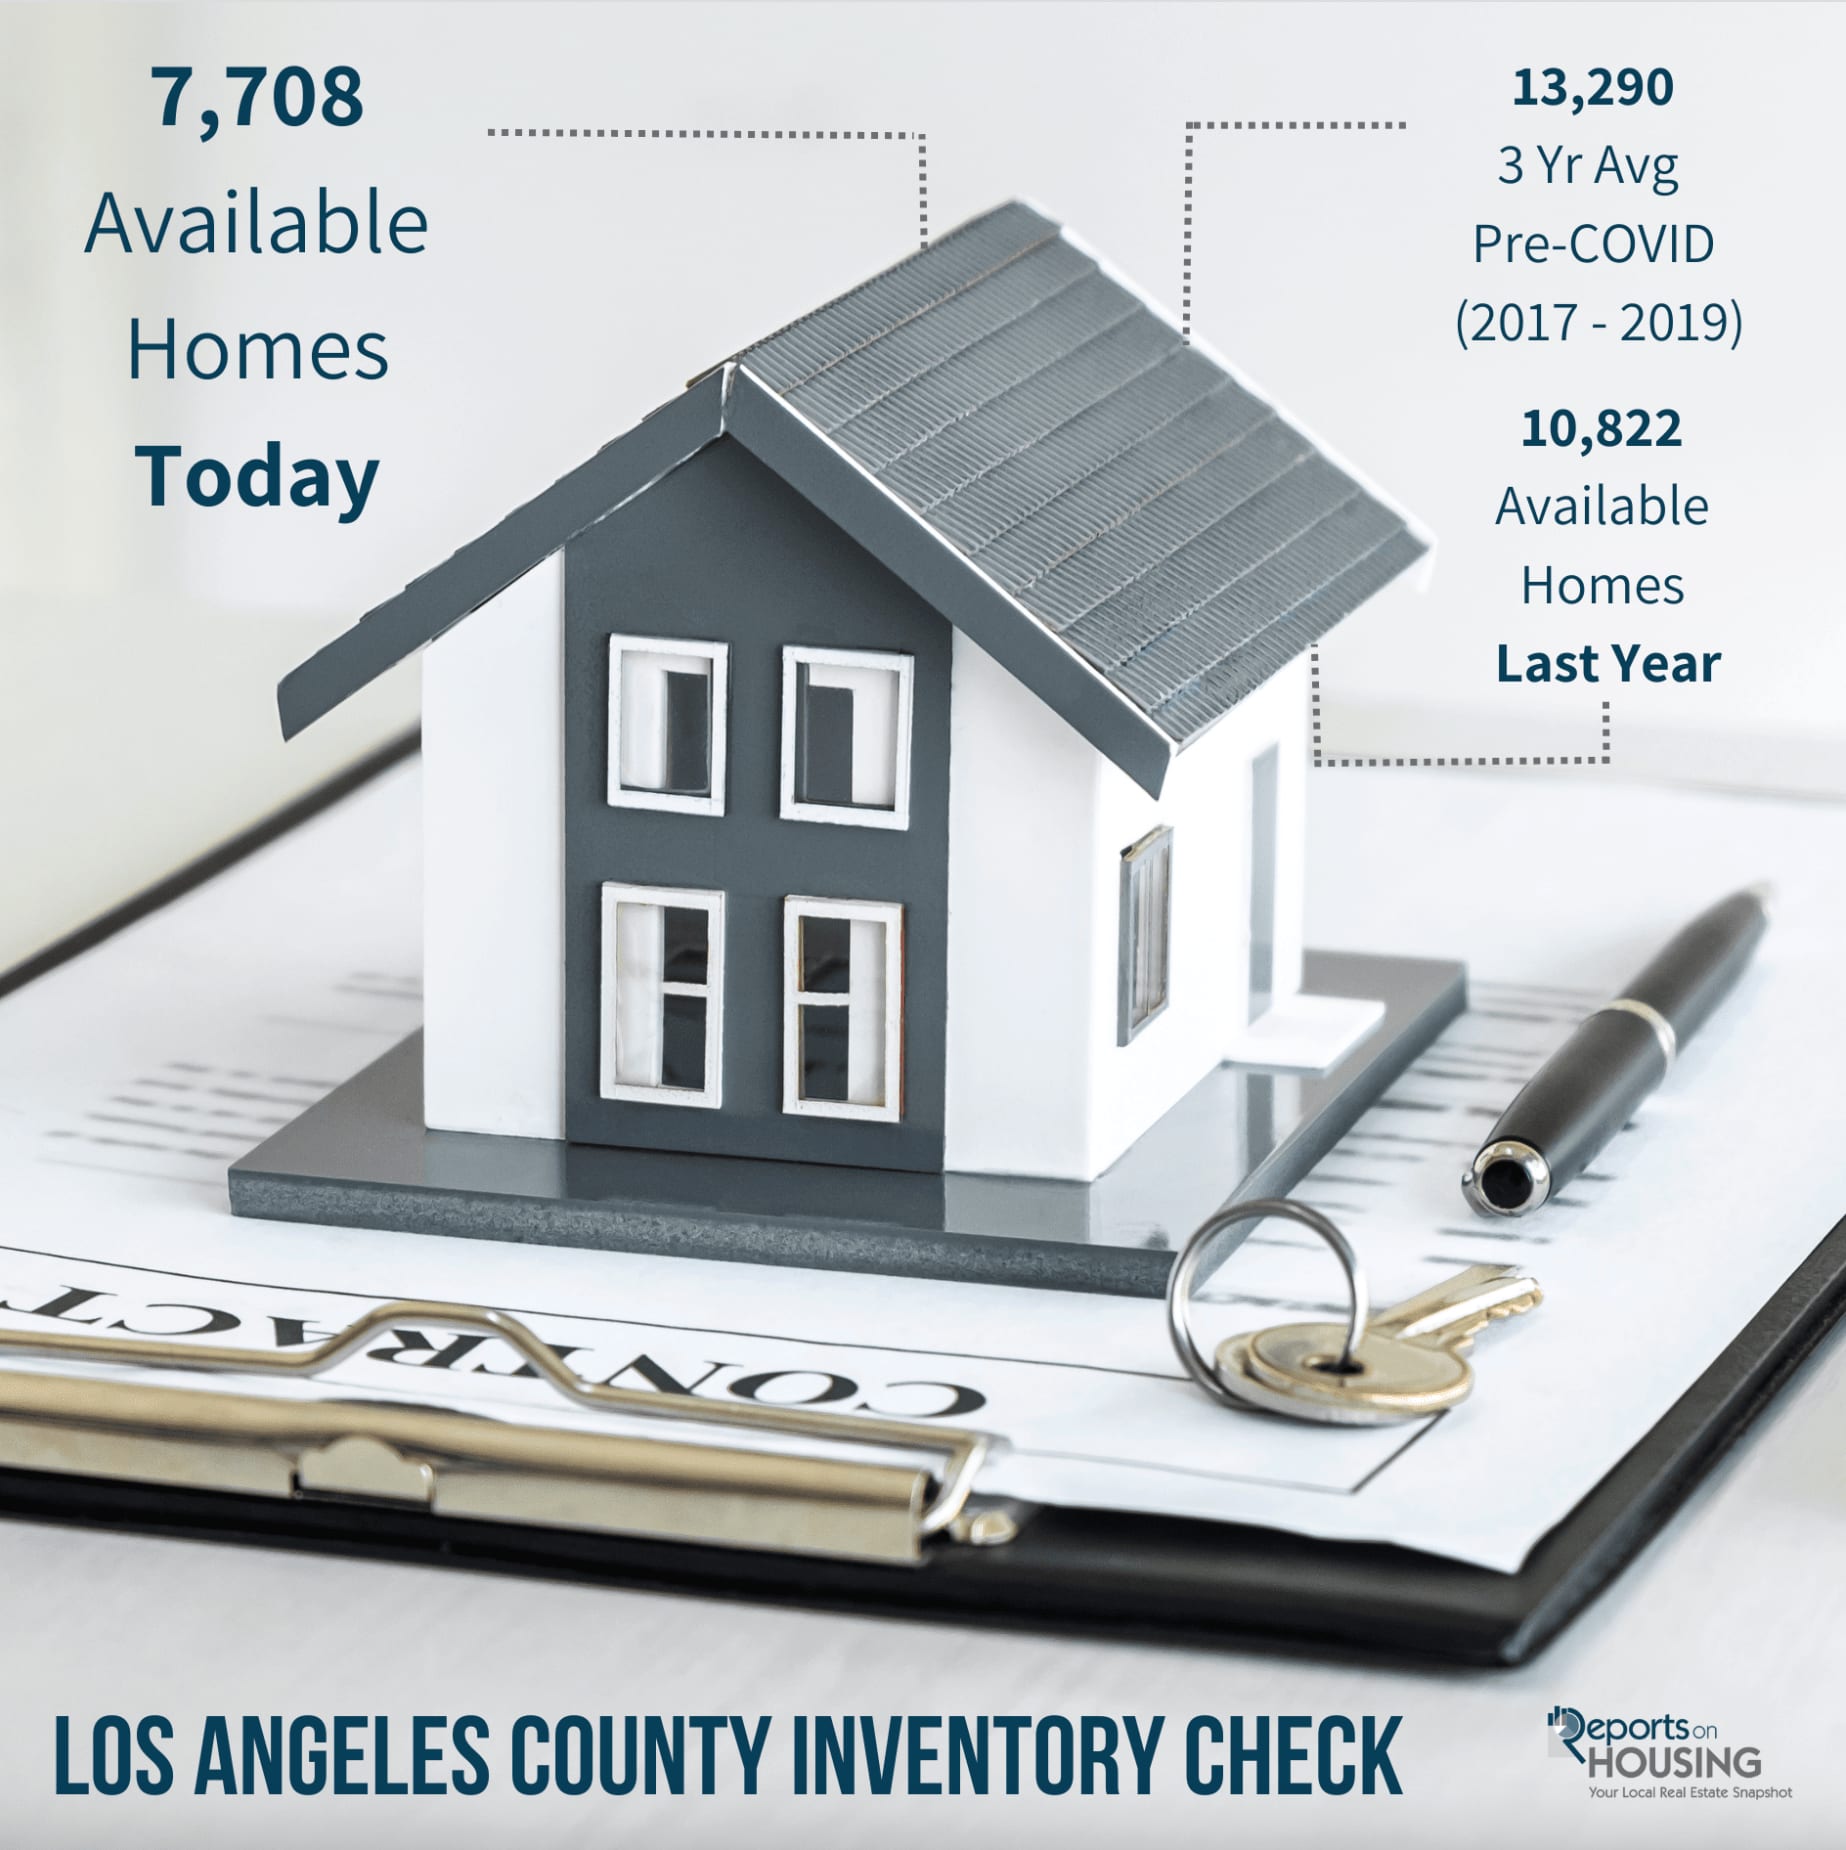
Active inventory
The active listing inventory in the past couple of weeks increased by 367 homes, up 5%, and now sits at 7,708 homes, its largest rise of the year. It is still the lowest level for an end to July since tracking began in 2012. In June, 35% fewer homes came on the market compared to the 3-year average before COVID (2017 to 2019), 3,066 less. Last year, there were 10,822 homes on the market, 3,114 extra homes, or 40% more. The 3-year average before COVID (2017 to 2019) was 13,290, or 72% more, nearly double.
Los Angeles County Housing Summary
- With supply rising, the Expected Market Time, the number of days to sell all Los Angeles County listings at the current buying pace, increased from 59 to 62 days in the past couple of weeks. It was 79 days last year, slower than today.
- For homes priced below $750,000, the Expected Market Time increased from 39 to 40 days in the past couple of weeks. This range represents 27% of the active inventory and 41% of demand.
- For homes priced between $750,000 and $1 million, the Expected Market Time increased from 41 to 43 days. This range represents 17% of the active inventory and 25% of demand.
- For homes priced between $1 million to $1.5 million, the Expected Market Time increased from 55 to 58 days. This range represents 16% of the active inventory and 18% of demand.
- For homes priced between $1.5 million to $2 million, the Expected Market Time increased from 81 to 89 days. This range represents 11% of the active inventory and 7% of demand.
- For homes priced between $2 million and $3 million, the Expected Market Time in the past couple of weeks increased from 103 to 125 days. For homes priced between $3 million and $4 million, the Expected Market Time increased from 163 to 177 days. For homes priced between $4 million and $8 million, the Expected Market Time decreased from 305 to 252 days. For homes priced above $8 million, the Expected Market Time increased from 707 to 1,401 days.
- The luxury end, all homes above $2 million, account for 30% of the inventory and 9.3% of demand.
- Distressed homes, both short sales and foreclosures combined, made up only 0.6% of all listings and 0.5% of demand. Only 29 foreclosures and 21 short sales are available to purchase today in all of Los Angeles County, 50 total distressed homes on the active market, up one in the past two weeks. Last year there were 36 total distressed homes on the market, slightly fewer than today.
- There were 4,552 closed residential resales in June, 19% less than June 2022’s 5,597 closed sales. June marked a 5% rise compared to May 2023. The sales-to-list price ratio was 100.2% for all of Los Angeles County. Foreclosures accounted for just 0.5% of all closed sales, and short sales accounted for 0.2%. That means that 99.3% of all sales were good ol’ fashioned sellers with equity.