Busting Myths
Ignore all the consistently negative social media channels and stick to the facts and data.
There are many myths circulating about the housing market, often spread through social media channels and negative narratives. However, it's important to stick to the facts and data rather than falling for doom and gloom stories. One prevalent myth is that housing is in a bubble about to crash. This is far from the truth - the current housing inventory is much lower than during the lead-up to the Great Recession, homeowner equity is strong, and lending standards are tighter. Another myth is that rising inventory levels are just as bad as last year, but inventory has actually been increasing recently compared to 2022 lows, even if still below pre-pandemic levels.
Additional myths are that prices will drop when mortgage rates fall, since more sellers will list their homes. However, lower rates also improve buyer affordability and purchasing power, likely increasing demand to outpace new inventory. There are also claims that rising unemployment will lead to a foreclosure wave, but the current 3.9% unemployment rate is still historically quite low. Furthermore, today's housing market has much tighter lending requirements compared to the subprime era before the Great Recession. With solid owner equity positions, the housing market appears resilient to moderate economic fluctuations. Overall, while challenges exist, many of the widely-circulated negative narratives do not align with the data and facts.
Active Listings
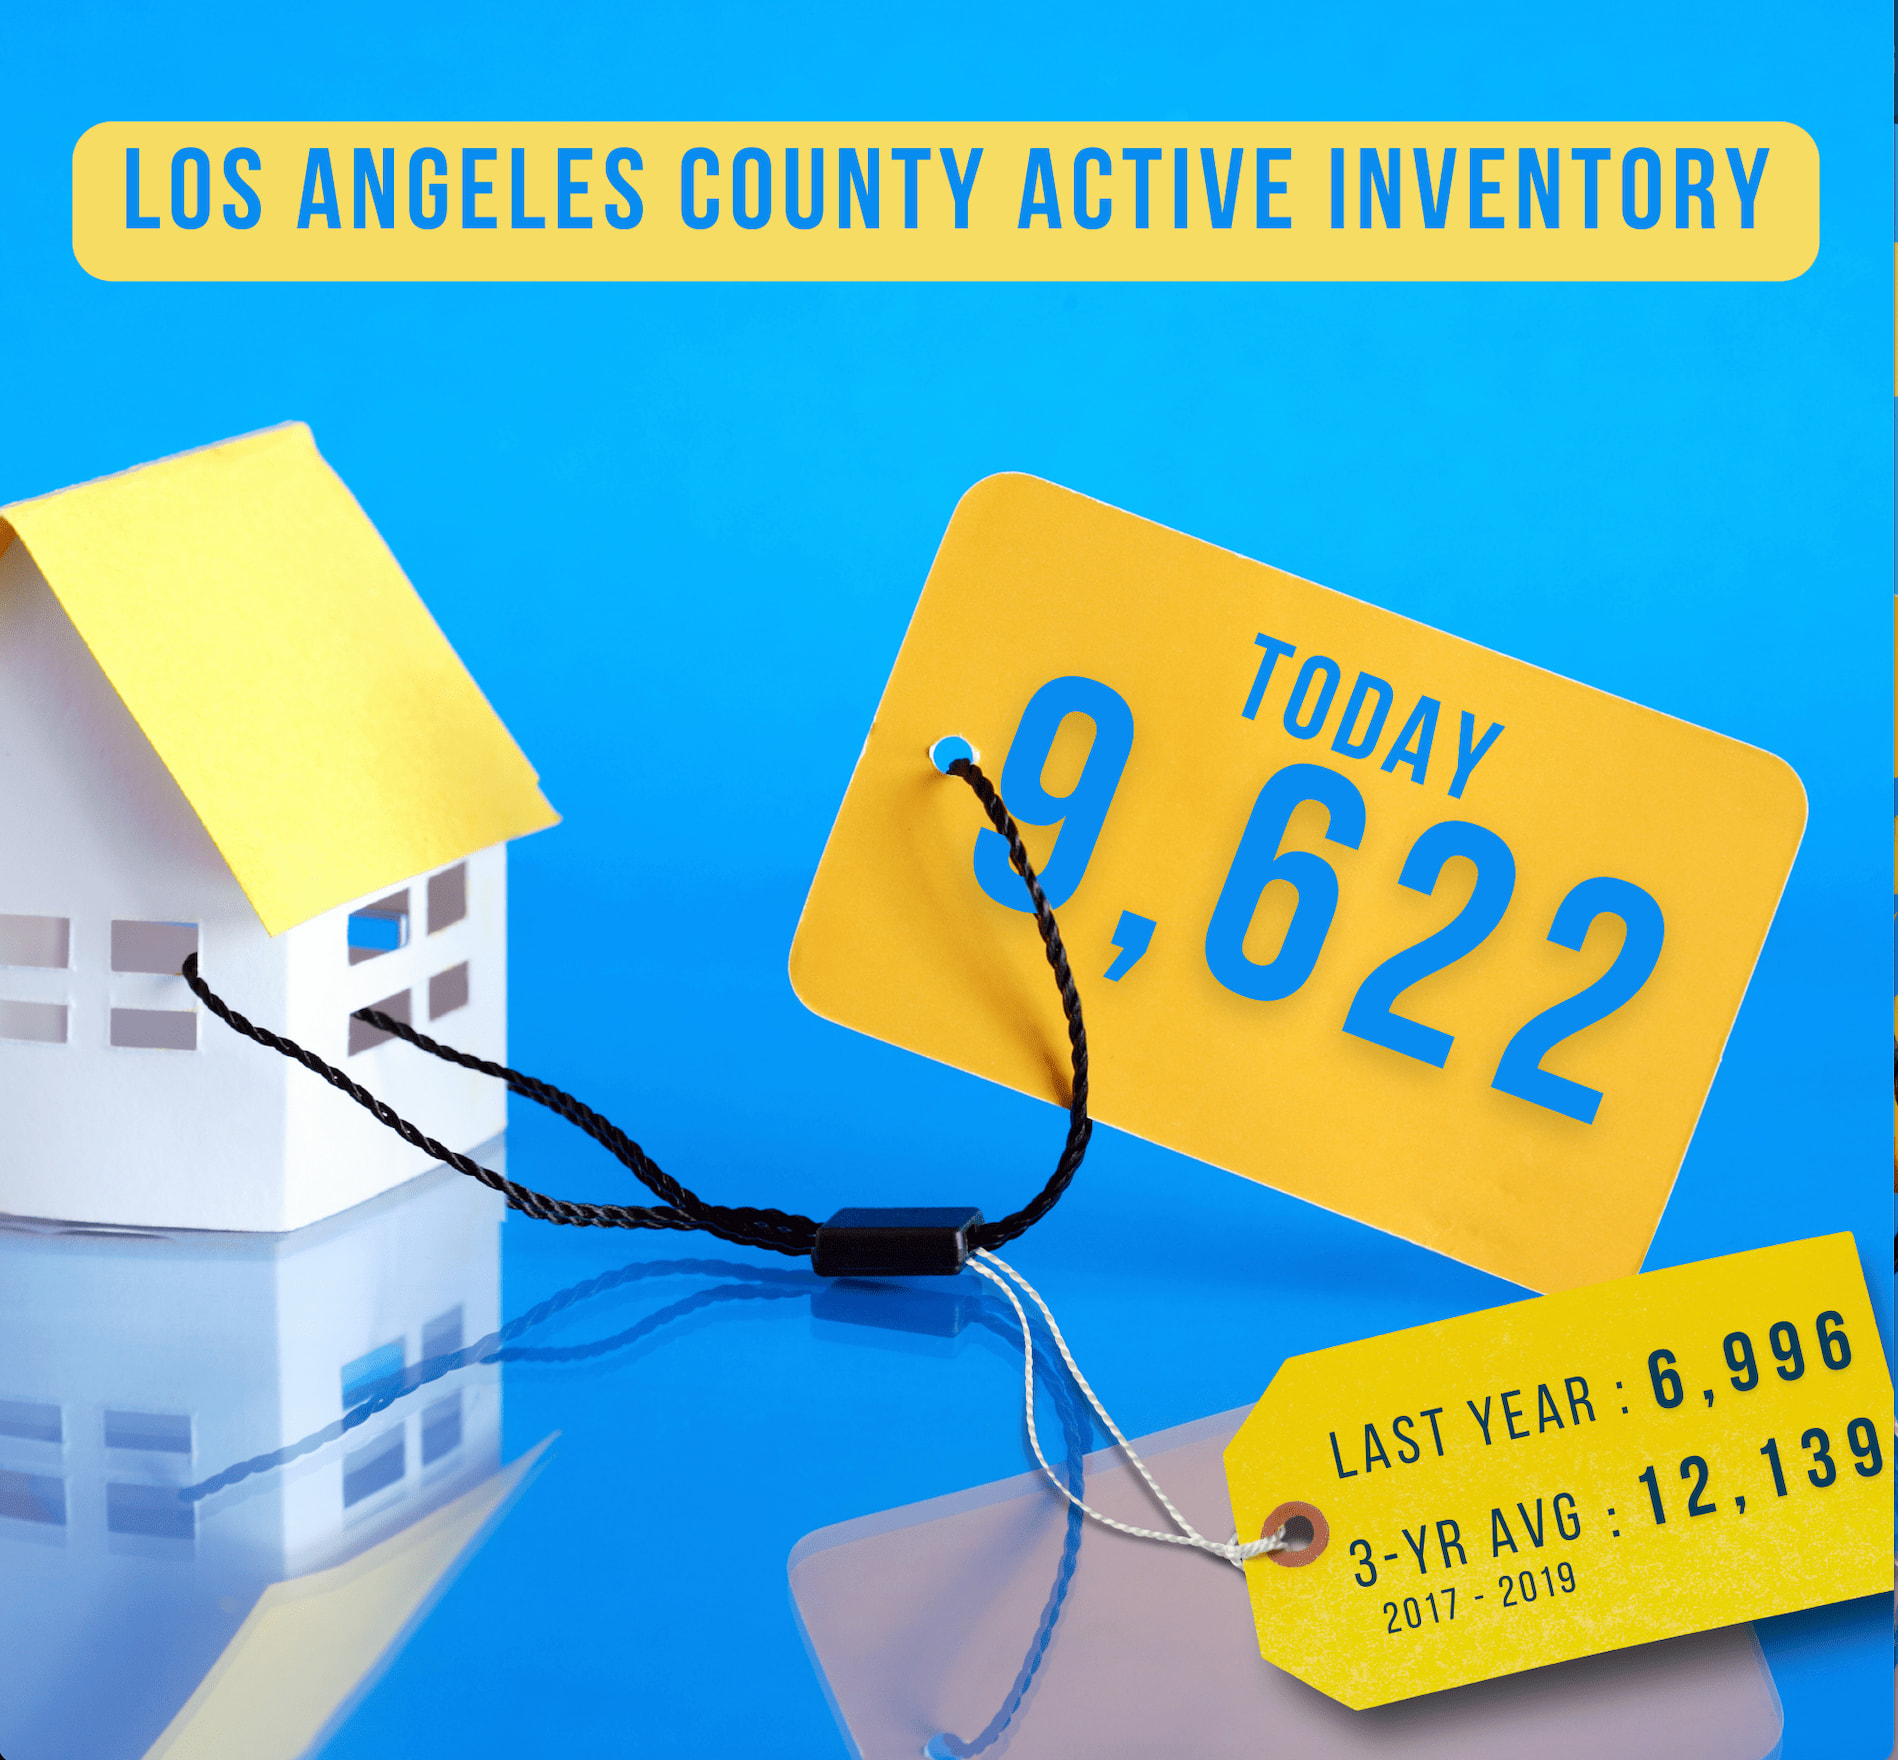
The active listing inventory in the past couple of weeks increased by 366 homes, up 4%, and now sits at 9,622 homes. In April, 23% fewer homes came on the market compared to the 3-year average before COVID (2017 to 2019), 2,076 less. 1,655 more sellers came on the market this year compared to April 2023. Last year, there were 6,996 homes on the market, 2,626 fewer homes, or 27% less. The 3-year average before COVID (2017 to 2019) was 12,139, or 26% more.
Demand
Demand, the number of pending sales over the prior month, decreased by 49 pending sales in the past two weeks, down 1%, and now totals 3,972. Last year, there were 4,011 pending sales, 1% more than today. The 3-year average before COVID (2017 to 2019) was 5,990, or 51% more.
Los Angeles County Housing Summary
- With supply rising and demand falling slightly, the Expected Market Time, the number of days to sell all Los Angeles County listings at the current buying pace, increased from 69 to 73 days in the past couple of weeks. It was 52 days last year, hotter than today. The 3-year average before COVID (2017 to 2019) was 62 days, faster than today.
- In the past couple of weeks, the Expected Market Time for homes priced below $750,000 increased from 51 to 54 days. This range represents 26% of the active inventory and 35% of demand.
- The Expected Market Time for homes priced between $750,000 and $1 million decreased from 48 to 47 days. This range represents 18% of the active inventory and 28% of demand.
- The Expected Market Time for homes priced between $1 million and $1.5 million increased from 62 to 65 days. This range represents 17% of the active inventory and 19% of demand.
- The Expected Market Time for homes priced between $1.5 million and $2 million increased from 86 to 91 days. This range represents 11% of the active inventory and 8% of demand.
- In the past two weeks, the Expected Market Time for homes priced between $2 million and $3 million increased from 118 to 124 days. The Expected Market Time for homes priced between $3 million and $4 million decreased from 176 to 165 days. The Expected Market Time for homes priced between $4 million and $8 million increased from 245 to 393 days. The Expected Market Time for homes priced above $8 million increased from 601 to 872 days.
- The luxury end, all homes above $2 million, account for 28% of the inventory and 10% of demand.
- Distressed homes, both short sales and foreclosures combined, made up only 0.6% of all listings and 0.9% of demand. Only 40 foreclosures and 20 short sales are available to purchase today in all of Los Angeles County, with 60 total distressed homes on the active market, down two from two weeks ago. Last year, there were 42 total distressed homes on the market, similar to today.
- There were 4,136 closed residential resales in April, up 14% compared to April 2023’s 3,642 closed sales, and up 10% from March 2024. The sales-to-list price ratio was 100.3% for all of Los Angeles County. Foreclosures accounted for just 0.4% of all closed sales, and short sales accounted for 0.1%. That means that 99.5% of all sales were good ol’ fashioned sellers with equity.
Contact me to schedule a consultation for recent facts, data, and expert guidance.